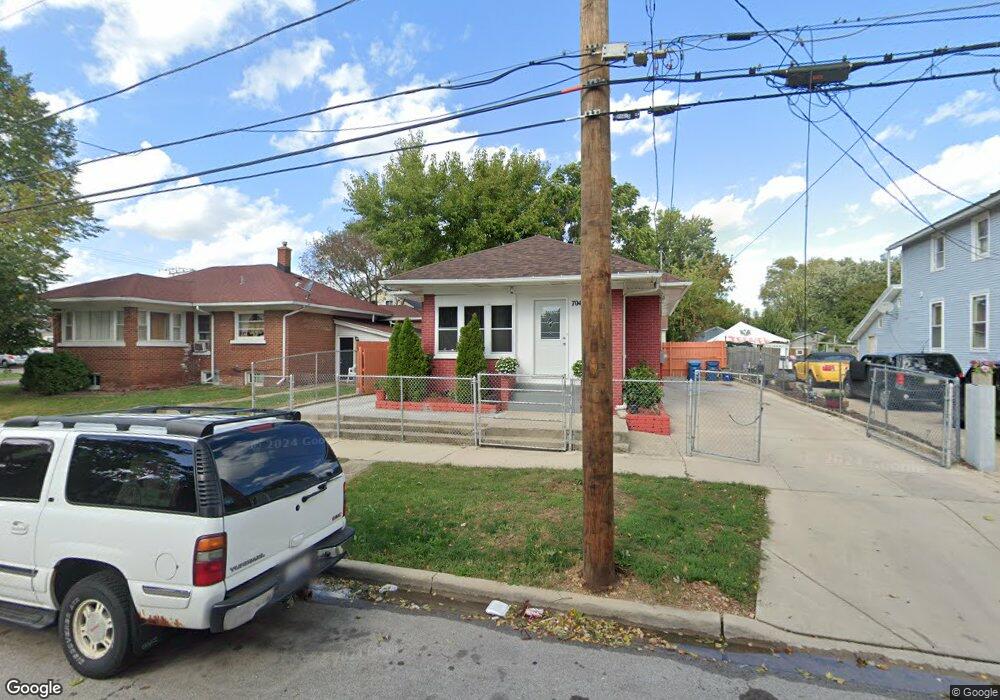
704 Fulton St Aurora, IL 60505
McCarty Burlington NeighborhoodEstimated Value: $199,000 - $220,000
2
Beds
2
Baths
913
Sq Ft
$225/Sq Ft
Est. Value
About This Home
This home is located at 704 Fulton St, Aurora, IL 60505 and is currently estimated at $205,869, approximately $225 per square foot. 704 Fulton St is a home located in Kane County with nearby schools including Edna Rollins Elementary School, Simmons Middle School, and East Aurora High School.
Ownership History
Date
Name
Owned For
Owner Type
Purchase Details
Closed on
May 13, 2010
Sold by
Secretary Of Housing & Urban Development
Bought by
Correa Cayetano
Current Estimated Value
Purchase Details
Closed on
Oct 6, 2009
Sold by
Rodriguez Juan
Bought by
The Secretary Of Housing & Urban Develop
Purchase Details
Closed on
Sep 4, 2002
Sold by
Rodriguez Ruben
Bought by
Rodriguez Juan
Home Financials for this Owner
Home Financials are based on the most recent Mortgage that was taken out on this home.
Original Mortgage
$113,223
Interest Rate
6.54%
Mortgage Type
FHA
Purchase Details
Closed on
May 28, 2002
Sold by
Kleinfieldt Romona
Bought by
Rodriguez Ruben
Home Financials for this Owner
Home Financials are based on the most recent Mortgage that was taken out on this home.
Original Mortgage
$52,200
Interest Rate
7%
Create a Home Valuation Report for This Property
The Home Valuation Report is an in-depth analysis detailing your home's value as well as a comparison with similar homes in the area
Home Values in the Area
Average Home Value in this Area
Purchase History
| Date | Buyer | Sale Price | Title Company |
|---|---|---|---|
| Correa Cayetano | -- | Stewart Title Company | |
| The Secretary Of Housing & Urban Develop | -- | None Available | |
| Rodriguez Juan | $120,000 | Law Title Insurance Co Inc | |
| Rodriguez Ruben | $58,000 | First American Title Co |
Source: Public Records
Mortgage History
| Date | Status | Borrower | Loan Amount |
|---|---|---|---|
| Previous Owner | Rodriguez Juan | $113,223 | |
| Previous Owner | Rodriguez Ruben | $52,200 |
Source: Public Records
Tax History Compared to Growth
Tax History
| Year | Tax Paid | Tax Assessment Tax Assessment Total Assessment is a certain percentage of the fair market value that is determined by local assessors to be the total taxable value of land and additions on the property. | Land | Improvement |
|---|---|---|---|---|
| 2024 | $2,501 | $44,478 | $4,866 | $39,612 |
| 2023 | $2,372 | $39,741 | $4,348 | $35,393 |
| 2022 | $2,299 | $36,260 | $3,967 | $32,293 |
| 2021 | $2,241 | $33,758 | $3,693 | $30,065 |
| 2020 | $2,109 | $31,356 | $3,430 | $27,926 |
| 2019 | $2,349 | $32,663 | $3,178 | $29,485 |
| 2018 | $2,140 | $29,504 | $2,940 | $26,564 |
| 2017 | $2,506 | $25,551 | $2,709 | $22,842 |
| 2016 | $2,298 | $21,839 | $2,322 | $19,517 |
| 2015 | -- | $20,259 | $1,997 | $18,262 |
| 2014 | -- | $19,398 | $1,835 | $17,563 |
| 2013 | -- | $22,674 | $1,753 | $20,921 |
Source: Public Records
Map
Nearby Homes
- 135 N Union St
- 139 N Union St
- 708 Fulton St
- 712 Fulton St
- 712 Fulton St Unit 1R
- 712 Fulton St Unit 2
- 143 N Union St
- 707 Fulton St
- 125 N Union St
- 716 Fulton St
- 145 N Union St
- 632 Fulton St
- 711 Fulton St
- 117 N Union St
- 718 Fulton St
- 149 N Union St
- 140 N Union St
- 715 Fulton St
- 709 Kane St
- 144 N Union St