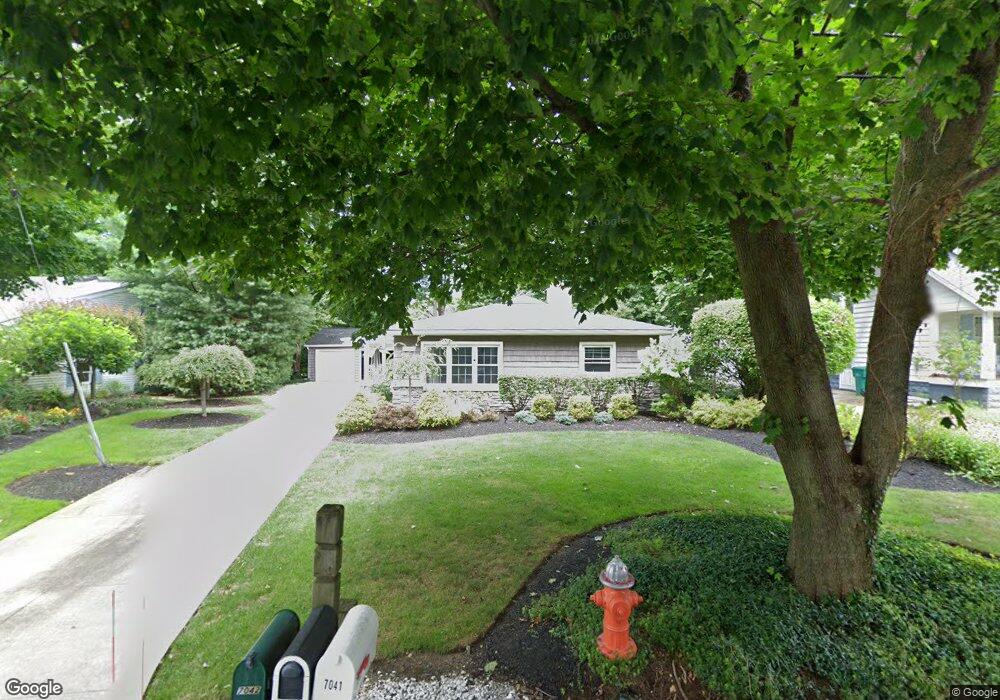
7042 Oak St Chagrin Falls, OH 44022
Estimated Value: $379,945 - $417,000
3
Beds
2
Baths
1,344
Sq Ft
$298/Sq Ft
Est. Value
About This Home
This home is located at 7042 Oak St, Chagrin Falls, OH 44022 and is currently estimated at $400,486, approximately $297 per square foot. 7042 Oak St is a home located in Geauga County with nearby schools including Gurney Elementary School, Chagrin Falls Intermediate Elementary School, and Chagrin Falls Middle School.
Ownership History
Date
Name
Owned For
Owner Type
Purchase Details
Closed on
Jul 9, 2019
Sold by
Ducca Marcella
Bought by
Ducca Daniel B and Ducca Marcella
Current Estimated Value
Purchase Details
Closed on
Jul 18, 2018
Sold by
Ducca Daniel B
Bought by
Ducca Marcella
Purchase Details
Closed on
Dec 15, 1995
Sold by
Turpin James E
Bought by
Fisher David E and Fisher Laura
Home Financials for this Owner
Home Financials are based on the most recent Mortgage that was taken out on this home.
Original Mortgage
$96,750
Interest Rate
7.45%
Mortgage Type
New Conventional
Purchase Details
Closed on
Jan 1, 1990
Bought by
Turpin James E
Create a Home Valuation Report for This Property
The Home Valuation Report is an in-depth analysis detailing your home's value as well as a comparison with similar homes in the area
Home Values in the Area
Average Home Value in this Area
Purchase History
| Date | Buyer | Sale Price | Title Company |
|---|---|---|---|
| Ducca Daniel B | -- | None Available | |
| Ducca Marcella | -- | None Available | |
| Fisher David E | $107,500 | -- | |
| Turpin James E | -- | -- |
Source: Public Records
Mortgage History
| Date | Status | Borrower | Loan Amount |
|---|---|---|---|
| Previous Owner | Fisher David E | $96,750 |
Source: Public Records
Tax History Compared to Growth
Tax History
| Year | Tax Paid | Tax Assessment Tax Assessment Total Assessment is a certain percentage of the fair market value that is determined by local assessors to be the total taxable value of land and additions on the property. | Land | Improvement |
|---|---|---|---|---|
| 2024 | $6,038 | $103,780 | $25,870 | $77,910 |
| 2023 | $6,038 | $103,780 | $25,870 | $77,910 |
| 2022 | $5,268 | $78,440 | $21,560 | $56,880 |
| 2021 | $5,284 | $78,440 | $21,560 | $56,880 |
| 2020 | $5,554 | $78,440 | $21,560 | $56,880 |
| 2019 | $5,549 | $65,310 | $21,560 | $43,750 |
| 2018 | $5,423 | $65,310 | $21,560 | $43,750 |
| 2017 | $5,549 | $65,310 | $21,560 | $43,750 |
| 2016 | $4,317 | $56,110 | $17,500 | $38,610 |
| 2015 | $4,158 | $56,110 | $17,500 | $38,610 |
| 2014 | $4,158 | $56,110 | $17,500 | $38,610 |
| 2013 | $4,187 | $56,110 | $17,500 | $38,610 |
Source: Public Records
Map
Nearby Homes