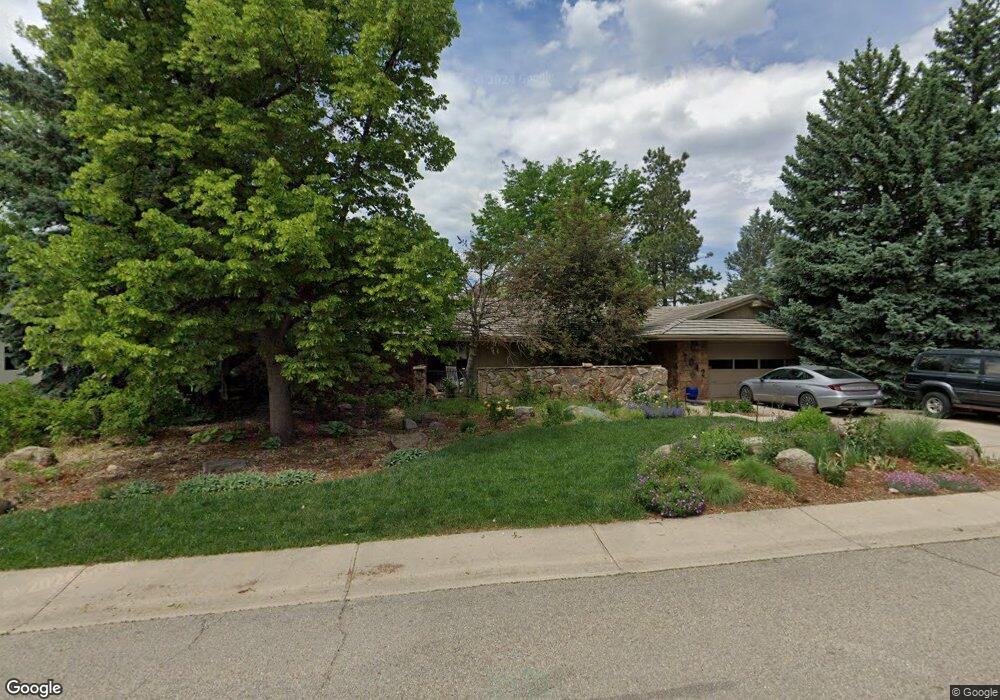
7042 Roaring Fork Trail Boulder, CO 80301
Gunbarrel NeighborhoodEstimated Value: $1,512,913 - $1,694,000
5
Beds
4
Baths
2,144
Sq Ft
$748/Sq Ft
Est. Value
About This Home
This home is located at 7042 Roaring Fork Trail, Boulder, CO 80301 and is currently estimated at $1,603,228, approximately $747 per square foot. 7042 Roaring Fork Trail is a home located in Boulder County with nearby schools including Heatherwood Elementary School, Nevin Platt Middle School, and Boulder High School.
Ownership History
Date
Name
Owned For
Owner Type
Purchase Details
Closed on
Dec 15, 1999
Sold by
Dave Peyton Clark Catherine Anne and Dave Kelvin
Bought by
Allen Michael J
Current Estimated Value
Home Financials for this Owner
Home Financials are based on the most recent Mortgage that was taken out on this home.
Original Mortgage
$500,000
Outstanding Balance
$136,086
Interest Rate
6.75%
Estimated Equity
$1,467,142
Purchase Details
Closed on
Oct 18, 1993
Sold by
Peyton Kelvin Dave
Bought by
Clark Catherine Anne
Home Financials for this Owner
Home Financials are based on the most recent Mortgage that was taken out on this home.
Original Mortgage
$297,000
Interest Rate
7.23%
Purchase Details
Closed on
Sep 7, 1993
Sold by
Beatty Dennis Eloise
Bought by
Peyton Kelvin D
Home Financials for this Owner
Home Financials are based on the most recent Mortgage that was taken out on this home.
Original Mortgage
$297,000
Interest Rate
7.23%
Create a Home Valuation Report for This Property
The Home Valuation Report is an in-depth analysis detailing your home's value as well as a comparison with similar homes in the area
Home Values in the Area
Average Home Value in this Area
Purchase History
| Date | Buyer | Sale Price | Title Company |
|---|---|---|---|
| Allen Michael J | $627,000 | -- | |
| Clark Catherine Anne | -- | -- | |
| Peyton Kelvin D | $330,000 | -- |
Source: Public Records
Mortgage History
| Date | Status | Borrower | Loan Amount |
|---|---|---|---|
| Open | Allen Michael J | $500,000 | |
| Previous Owner | Peyton Kelvin D | $297,000 |
Source: Public Records
Tax History
| Year | Tax Paid | Tax Assessment Tax Assessment Total Assessment is a certain percentage of the fair market value that is determined by local assessors to be the total taxable value of land and additions on the property. | Land | Improvement |
|---|---|---|---|---|
| 2025 | $9,130 | $103,269 | $45,131 | $58,138 |
| 2024 | $9,130 | $103,269 | $45,131 | $58,138 |
| 2023 | $8,979 | $105,599 | $48,582 | $60,702 |
| 2022 | $7,064 | $79,466 | $35,737 | $43,729 |
| 2021 | $7,378 | $81,753 | $36,765 | $44,988 |
| 2020 | $6,453 | $70,692 | $31,317 | $39,375 |
| 2019 | $6,355 | $70,692 | $31,317 | $39,375 |
| 2018 | $6,482 | $71,316 | $26,784 | $44,532 |
| 2017 | $6,288 | $78,844 | $29,611 | $49,233 |
| 2016 | $5,602 | $61,674 | $24,278 | $37,396 |
| 2015 | $5,319 | $56,643 | $30,964 | $25,679 |
| 2014 | $5,150 | $56,643 | $30,964 | $25,679 |
Source: Public Records
Map
Nearby Homes
- 6972 Roaring Fork Trail
- 5292 Sun Dial Place
- 0 Cottonwood Dr
- 5237 Deer Creek Ct
- 6923 Hunter Place
- 5302 Pinehurst Dr
- 7134 Cedarwood Cir
- 6844 Roaring Fork Trail
- 7309 Windsor Dr
- 5273 Idylwild Trail
- 7088 Indian Peaks Trail
- 6838 Harvest Rd
- 4872 Country Club Way
- 4862 Silver Sage Ct
- 5012 Carter Ct
- 4953 Clubhouse Ct
- 4945 Twin Lakes Rd Unit 39
- 7400 Singing Hills Dr Unit K7400
- 5531 High Country Ct
- 7240 Glacier View Rd
- 7032 Roaring Fork Trail
- 7050 Roaring Fork Trail
- 7033 Roaring Fork Trail
- 7051 Roaring Fork Trail
- 7030 Roaring Fork Trail
- 7031 Roaring Fork Trail
- 7060 Roaring Fork Trail
- 7047 Yampa Ct
- 7014 Roaring Fork Trail
- 7035 Yampa Ct
- 7075 Roaring Fork Trail
- 7017 Roaring Fork Trail
- 7041 Yampa Ct
- 7006 Roaring Fork Trail
- 7091 Roaring Fork Trail
- 7037 Yampa Ct
- 5240 Sun Dial Place
- 5242 Sun Dial Place
- 6990 Roaring Fork Trail
- 7013 Roaring Fork Trail
Your Personal Tour Guide
Ask me questions while you tour the home.