705 Carman Oaks Ct Ballwin, MO 63021
Twin Oaks NeighborhoodEstimated Value: $540,000 - $576,000
4
Beds
3
Baths
2,408
Sq Ft
$231/Sq Ft
Est. Value
About This Home
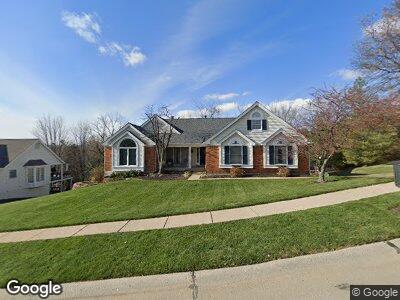
This home is located at 705 Carman Oaks Ct, Ballwin, MO 63021 and is currently estimated at $555,831, approximately $230 per square foot. 705 Carman Oaks Ct is a home located in St. Louis County with nearby schools including Carman Trails Elementary School, Parkway South Middle School, and Parkway South High School.
Ownership History
Date
Name
Owned For
Owner Type
Purchase Details
Closed on
Dec 20, 2016
Sold by
Wenk Theodore Kenneth and Wenk Jill Marie
Bought by
Declaration Of Trust Of Theodore Kenneth
Current Estimated Value
Purchase Details
Closed on
Jan 15, 2009
Sold by
Hoffman Connie J and Hoffman David M
Bought by
Wenk Theodore K and Wenk Jill M
Home Financials for this Owner
Home Financials are based on the most recent Mortgage that was taken out on this home.
Original Mortgage
$265,000
Interest Rate
5.48%
Mortgage Type
Purchase Money Mortgage
Purchase Details
Closed on
May 1, 2002
Sold by
Hoffman David M and Hoffman Connie J
Bought by
Hoffman Connie J and Hoffman David M
Create a Home Valuation Report for This Property
The Home Valuation Report is an in-depth analysis detailing your home's value as well as a comparison with similar homes in the area
Home Values in the Area
Average Home Value in this Area
Purchase History
| Date | Buyer | Sale Price | Title Company |
|---|---|---|---|
| Declaration Of Trust Of Theodore Kenneth | -- | None Available | |
| Wenk Theodore K | -- | None Available | |
| Hoffman Connie J | -- | -- |
Source: Public Records
Mortgage History
| Date | Status | Borrower | Loan Amount |
|---|---|---|---|
| Open | Wenk Jill M | $142,800 | |
| Closed | Wenk Theodore K | $120,350 | |
| Closed | Wenk Theodore Kenneth | $150,000 | |
| Closed | Wenk Ted | $119,350 | |
| Closed | Wenk Jill M | $15,350 | |
| Closed | Wenk | $257,500 | |
| Closed | Wenk Theodore K | $259,300 | |
| Closed | Ted Ted K | $20,000 | |
| Closed | Wenk Theodore K | $265,000 | |
| Previous Owner | Hoffman | $304,500 |
Source: Public Records
Tax History Compared to Growth
Tax History
| Year | Tax Paid | Tax Assessment Tax Assessment Total Assessment is a certain percentage of the fair market value that is determined by local assessors to be the total taxable value of land and additions on the property. | Land | Improvement |
|---|---|---|---|---|
| 2023 | $6,838 | $99,470 | $37,830 | $61,640 |
| 2022 | $6,483 | $86,680 | $34,050 | $52,630 |
| 2021 | $6,446 | $86,680 | $34,050 | $52,630 |
| 2020 | $6,291 | $80,990 | $23,120 | $57,870 |
| 2019 | $6,199 | $80,990 | $23,120 | $57,870 |
| 2018 | $5,751 | $69,690 | $23,120 | $46,570 |
| 2017 | $5,510 | $69,690 | $23,120 | $46,570 |
| 2016 | $5,446 | $64,020 | $14,520 | $49,500 |
| 2015 | $5,688 | $64,020 | $14,520 | $49,500 |
| 2014 | $4,491 | $56,150 | $20,050 | $36,100 |
Source: Public Records
Map
Nearby Homes
- 712 Carman Oaks Ct
- 1444 Sunnytree Ln
- 726 Carman Woods Dr
- 1703 Blakefield Terrace
- 712 Ridgeview Circle Ln Unit 712
- 889 Almond Hill Ct
- 601 Waterford Ridge Ct
- 651 Waterford Ridge Dr
- 1700 Highview Circle Ct
- 733 La Bonne Pkwy
- 800 Dinard Dr
- 1709 Highview Circle Ct Unit 1709
- 664 Dougherty Estates Dr
- 626 Highview Circle Dr Unit 626
- 1042 Carman Rd
- 632 Waterford View Ct
- 269 Braeshire Dr
- 604 Glyn Cagny Rd
- 1261 Mautenne Dr
- 922 Pontoison Dr
- 705 Carman Oaks Ct
- 709 Carman Oaks Ct
- 715 Carman Oaks Ct
- 1530 Carman Rd
- 703 Carman Meadows Dr
- 707 Carman Meadows Dr
- 715 Carman Meadows Dr
- 1515 Carman Glen Ct
- 697 Carman Meadows Dr
- 1509 Carman Glen Ct
- 708 Carman Oaks Ct
- 719 Carman Meadows Dr
- 706 Carman Meadows Dr S
- 1533 Carman Rd
- 716 Carman Oaks Ct
- 706 Carman Meadows Dr
- 720 Carman Oaks Ct
- 1527 Carman Rd
- 725 Carman Meadows Dr
- 691 Carman Meadows Dr