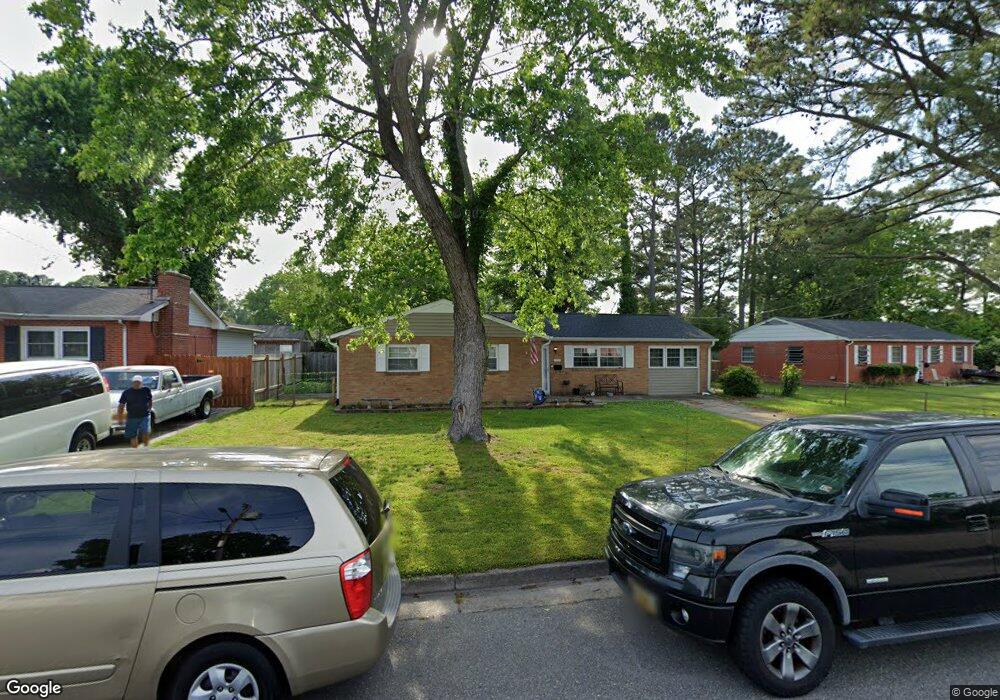
705 Kings View Ct Hampton, VA 23669
Fox Hill NeighborhoodEstimated Value: $291,000 - $315,000
4
Beds
3
Baths
1,507
Sq Ft
$202/Sq Ft
Est. Value
About This Home
This home is located at 705 Kings View Ct, Hampton, VA 23669 and is currently estimated at $303,842, approximately $201 per square foot. 705 Kings View Ct is a home located in Hampton City with nearby schools including Phillips Elementary School, Benjamin Syms Middle School, and Kecoughtan High School.
Ownership History
Date
Name
Owned For
Owner Type
Purchase Details
Closed on
Apr 5, 2017
Sold by
Johnson Todd B
Bought by
Ferk Jason D and Ferk Michael M
Current Estimated Value
Purchase Details
Closed on
Oct 26, 2011
Sold by
Trj Properties Llc
Bought by
Cerezo Maryiha R
Home Financials for this Owner
Home Financials are based on the most recent Mortgage that was taken out on this home.
Original Mortgage
$177,077
Interest Rate
4.08%
Mortgage Type
VA
Purchase Details
Closed on
Jun 29, 2011
Sold by
Fannie Mae
Bought by
Trj Properties Llc
Home Financials for this Owner
Home Financials are based on the most recent Mortgage that was taken out on this home.
Original Mortgage
$100,000
Interest Rate
4.6%
Mortgage Type
New Conventional
Purchase Details
Closed on
Sep 15, 2010
Sold by
Samuel I White Pc Sub Tr
Bought by
Federal National Mortgage Association
Create a Home Valuation Report for This Property
The Home Valuation Report is an in-depth analysis detailing your home's value as well as a comparison with similar homes in the area
Home Values in the Area
Average Home Value in this Area
Purchase History
| Date | Buyer | Sale Price | Title Company |
|---|---|---|---|
| Ferk Jason D | $180,000 | Attorney | |
| Cerezo Maryiha R | $173,350 | -- | |
| Trj Properties Llc | $81,750 | -- | |
| Federal National Mortgage Association | $150,160 | -- |
Source: Public Records
Mortgage History
| Date | Status | Borrower | Loan Amount |
|---|---|---|---|
| Previous Owner | Cerezo Maryiha R | $177,077 | |
| Previous Owner | Trj Properties Llc | $100,000 |
Source: Public Records
Tax History
| Year | Tax Paid | Tax Assessment Tax Assessment Total Assessment is a certain percentage of the fair market value that is determined by local assessors to be the total taxable value of land and additions on the property. | Land | Improvement |
|---|---|---|---|---|
| 2025 | $3,218 | $274,500 | $60,000 | $214,500 |
| 2024 | $3,011 | $261,800 | $60,000 | $201,800 |
| 2023 | $2,850 | $245,700 | $60,000 | $185,700 |
| 2022 | $2,644 | $224,100 | $55,000 | $169,100 |
| 2021 | $2,483 | $189,800 | $50,000 | $139,800 |
| 2020 | $2,259 | $182,200 | $45,000 | $137,200 |
| 2019 | $2,191 | $176,700 | $45,000 | $131,700 |
| 2018 | $2,178 | $169,300 | $45,000 | $124,300 |
| 2017 | $2,193 | $0 | $0 | $0 |
| 2016 | $2,162 | $166,800 | $0 | $0 |
| 2015 | $2,162 | $0 | $0 | $0 |
| 2014 | $1,856 | $139,100 | $45,000 | $94,100 |
Source: Public Records
Map
Nearby Homes
- 702 Nottingham Dr
- 702 Kings View Ct
- 635 Kings View Ct
- 639 Fairfield Blvd
- 702 New Bern Ave
- 619 Queens View Ct
- 426 Stockton St
- 446 Beaumont St
- 709 Whitney Ct
- 475 Fox Hill Rd
- 820 Lemaster Ave
- 112 Pine Creek Dr
- 353 Fox Hill Rd
- 906 Allendale Dr
- 943 Allendale Dr
- 926 Allendale Dr
- 22 Camellia Ln
- 20 Aster Way
- 142 River Walk Ct
- 10 Zilber Ct
- 703 Kings View Ct
- 707 Kings View Ct
- 704 Nottingham Dr
- 706 Nottingham Dr
- 701 Kings View Ct
- 709 Kings View Ct
- 704 Kings View Ct
- 708 Nottingham Dr
- 700 Nottingham Dr
- 706 Kings View Ct
- 700 Kings View Ct
- 710 Kings View Ct
- 710 Nottingham Dr
- 708 Kings View Ct
- 450 Fort Worth St
- 450 Stockton St
- 705 Fairfield Blvd
- 705 Nottingham Dr
- 703 Fairfield Blvd
- 707 Fairfield Blvd
Your Personal Tour Guide
Ask me questions while you tour the home.