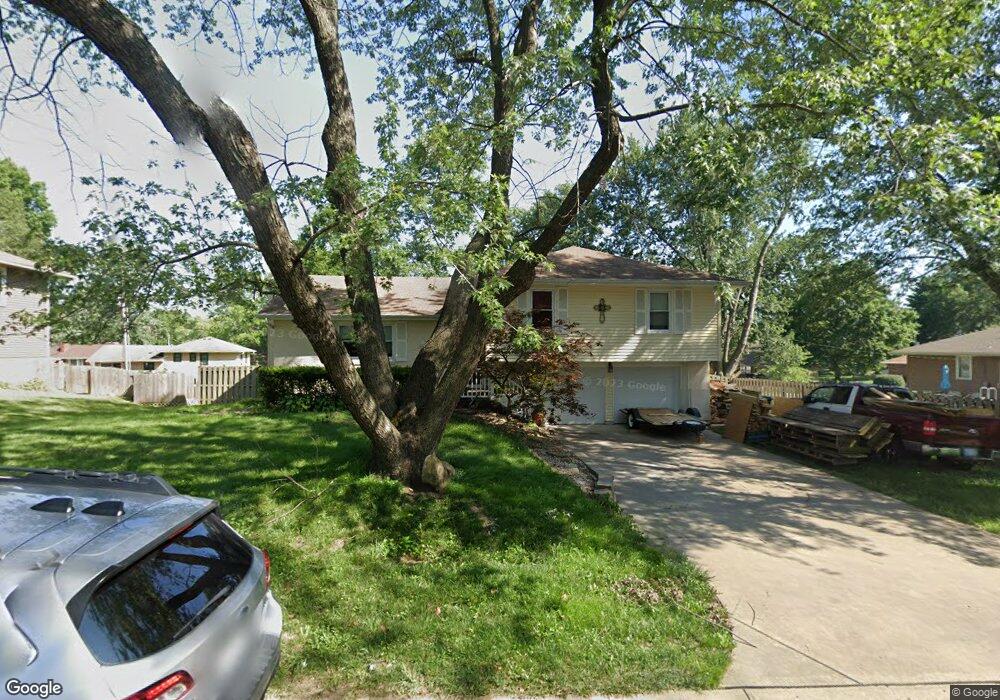
705 N Apache Dr Independence, MO 64056
Randall NeighborhoodEstimated Value: $253,050 - $318,000
3
Beds
3
Baths
1,859
Sq Ft
$151/Sq Ft
Est. Value
About This Home
This home is located at 705 N Apache Dr, Independence, MO 64056 and is currently estimated at $281,013, approximately $151 per square foot. 705 N Apache Dr is a home located in Jackson County with nearby schools including Randall Elementary School, Bridger Middle School, and Bingham Middle School.
Ownership History
Date
Name
Owned For
Owner Type
Purchase Details
Closed on
Jan 31, 2006
Sold by
Reese Edward B
Bought by
Summers Ronald F and Summers Eugenia A
Current Estimated Value
Home Financials for this Owner
Home Financials are based on the most recent Mortgage that was taken out on this home.
Original Mortgage
$108,500
Interest Rate
6.24%
Mortgage Type
Fannie Mae Freddie Mac
Purchase Details
Closed on
Mar 10, 2003
Sold by
Reiff Terry D and Reiff Ronald E
Bought by
Reese Edward B
Home Financials for this Owner
Home Financials are based on the most recent Mortgage that was taken out on this home.
Original Mortgage
$124,000
Interest Rate
5.86%
Mortgage Type
Purchase Money Mortgage
Purchase Details
Closed on
Nov 1, 2000
Sold by
Reiff Vernon R
Bought by
Jack Judy C and Woods Susan J
Purchase Details
Closed on
Oct 15, 1997
Sold by
Reiff Margaret E
Bought by
Reiff Vernon R
Create a Home Valuation Report for This Property
The Home Valuation Report is an in-depth analysis detailing your home's value as well as a comparison with similar homes in the area
Home Values in the Area
Average Home Value in this Area
Purchase History
| Date | Buyer | Sale Price | Title Company |
|---|---|---|---|
| Summers Ronald F | -- | Kansas City Title | |
| Reese Edward B | -- | Security Land Title Company | |
| Jack Judy C | -- | -- | |
| Reiff Vernon R | -- | -- |
Source: Public Records
Mortgage History
| Date | Status | Borrower | Loan Amount |
|---|---|---|---|
| Closed | Summers Ronald F | $108,500 | |
| Previous Owner | Reese Edward B | $124,000 |
Source: Public Records
Tax History
| Year | Tax Paid | Tax Assessment Tax Assessment Total Assessment is a certain percentage of the fair market value that is determined by local assessors to be the total taxable value of land and additions on the property. | Land | Improvement |
|---|---|---|---|---|
| 2025 | $2,117 | $34,316 | $5,913 | $28,403 |
| 2024 | $2,069 | $30,554 | $3,990 | $26,564 |
| 2023 | $2,069 | $30,554 | $3,205 | $27,349 |
| 2022 | $2,470 | $33,440 | $6,332 | $27,108 |
| 2021 | $2,469 | $33,440 | $6,332 | $27,108 |
| 2020 | $2,274 | $29,922 | $6,332 | $23,590 |
| 2019 | $2,237 | $29,922 | $6,332 | $23,590 |
| 2018 | $2,040 | $26,042 | $5,511 | $20,531 |
| 2017 | $2,040 | $26,042 | $5,511 | $20,531 |
| 2016 | $1,982 | $25,050 | $4,110 | $20,940 |
Source: Public Records
Map
Nearby Homes
- 17301 E Cheyenne Dr
- 17293 E Cheyenne Dr
- 809 N Swope Dr
- 801 N Redwood Dr
- 0 Bundschu Rd Unit HMS2577360
- 827 N Choctaw Ave
- 829 N Choctaw Ave
- 411 N Queen Ridge Ave
- 18508 E 8th St N
- 16501 E 3rd St N
- 1113 N Swope Dr
- 18505 E 5th St N
- 1116 N Swope Dr
- 1207 N Atherton Rd
- 18001 E 12th St N
- 17008 E 2nd St S
- 18602 E 6th St N
- 17301 E Kentucky Rd
- 834 N Ponca Dr
- 320 N M 291 Hwy
- 707 N Apache Dr
- 703 N Apache Dr
- 702 N Piute Ave
- 17504 E Cheyenne Dr
- 706 N Apache Dr
- 700 N Piute Ave
- 709 N Apache Dr
- 708 N Apache Dr
- 704 N Piute Ave
- 702 N Apache Dr
- 710 N Apache Dr
- 706 N Piute Ave
- 700 N Apache Dr
- 709 N Swope Dr
- 703 N Piute Ave
- 711 N Swope Dr
- 711 N Apache Dr
- 17505 E Cheyenne Dr
- 707 N Swope Dr
- 17503 E Cheyenne Dr
Your Personal Tour Guide
Ask me questions while you tour the home.