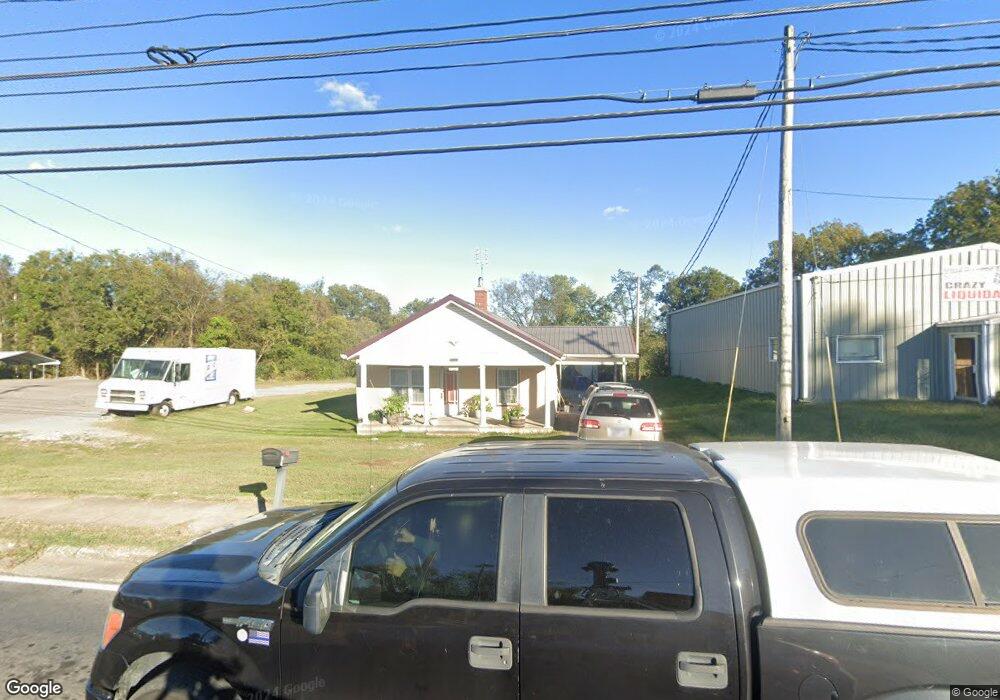
705 S Cannon Blvd Shelbyville, TN 37160
Estimated Value: $148,431 - $233,000
--
Bed
1
Bath
1,064
Sq Ft
$180/Sq Ft
Est. Value
About This Home
This home is located at 705 S Cannon Blvd, Shelbyville, TN 37160 and is currently estimated at $191,608, approximately $180 per square foot. 705 S Cannon Blvd is a home located in Bedford County with nearby schools including South Side Elementary School, Harris Middle School, and Christian Chapel Academy.
Ownership History
Date
Name
Owned For
Owner Type
Purchase Details
Closed on
Jul 21, 2022
Sold by
Ortiz Gutierrez Noe
Bought by
Guttierrez Noe Ortiz and Saldana Erika Zulema
Current Estimated Value
Home Financials for this Owner
Home Financials are based on the most recent Mortgage that was taken out on this home.
Original Mortgage
$70,000
Outstanding Balance
$66,907
Interest Rate
5.81%
Mortgage Type
New Conventional
Estimated Equity
$124,701
Purchase Details
Closed on
May 17, 2010
Sold by
Gordon Lynnette Ernestina
Bought by
Gutierrez Noe Ortiz
Purchase Details
Closed on
Feb 19, 2004
Sold by
Bartlett Roy Mitchell
Bought by
Gutierrez Noe Ortiz
Home Financials for this Owner
Home Financials are based on the most recent Mortgage that was taken out on this home.
Original Mortgage
$58,500
Interest Rate
4.5%
Create a Home Valuation Report for This Property
The Home Valuation Report is an in-depth analysis detailing your home's value as well as a comparison with similar homes in the area
Home Values in the Area
Average Home Value in this Area
Purchase History
| Date | Buyer | Sale Price | Title Company |
|---|---|---|---|
| Guttierrez Noe Ortiz | -- | None Listed On Document | |
| Gutierrez Noe Ortiz | -- | -- | |
| Gutierrez Noe Ortiz | $65,000 | -- |
Source: Public Records
Mortgage History
| Date | Status | Borrower | Loan Amount |
|---|---|---|---|
| Open | Guttierrez Noe Ortiz | $70,000 | |
| Previous Owner | Gutierrez Noe Ortiz | $58,500 |
Source: Public Records
Tax History Compared to Growth
Tax History
| Year | Tax Paid | Tax Assessment Tax Assessment Total Assessment is a certain percentage of the fair market value that is determined by local assessors to be the total taxable value of land and additions on the property. | Land | Improvement |
|---|---|---|---|---|
| 2025 | -- | $25,950 | $0 | $0 |
| 2024 | -- | $25,950 | $8,225 | $17,725 |
| 2023 | $987 | $25,950 | $8,225 | $17,725 |
| 2022 | $1,016 | $25,950 | $8,225 | $17,725 |
| 2021 | $923 | $25,950 | $8,225 | $17,725 |
| 2020 | $776 | $25,950 | $8,225 | $17,725 |
| 2019 | $776 | $17,525 | $4,500 | $13,025 |
| 2018 | $759 | $17,525 | $4,500 | $13,025 |
| 2017 | $759 | $17,525 | $4,500 | $13,025 |
| 2016 | $752 | $17,525 | $4,500 | $13,025 |
| 2015 | $752 | $17,525 | $4,500 | $13,025 |
| 2014 | $655 | $16,698 | $0 | $0 |
Source: Public Records
Map
Nearby Homes
- 703 S Cannon Blvd
- 701 S Cannon Blvd
- 715 S Cannon Blvd
- 702 S Cannon Blvd
- 404 Lewis Ave
- 406 Lewis Ave
- 408 Lewis Ave
- 714 S Cannon Blvd
- 410 Lewis Ave
- 613 S Cannon Blvd
- 413 Lewis Ave
- 412 Lewis Ave
- 721 S Cannon Blvd
- 611 S Cannon Blvd
- 716 S Cannon Blvd
- 415 Lewis Ave
- 414 Lewis Ave
- 609 S Cannon Blvd
- 723 S Cannon Blvd
- 416 Lewis Ave