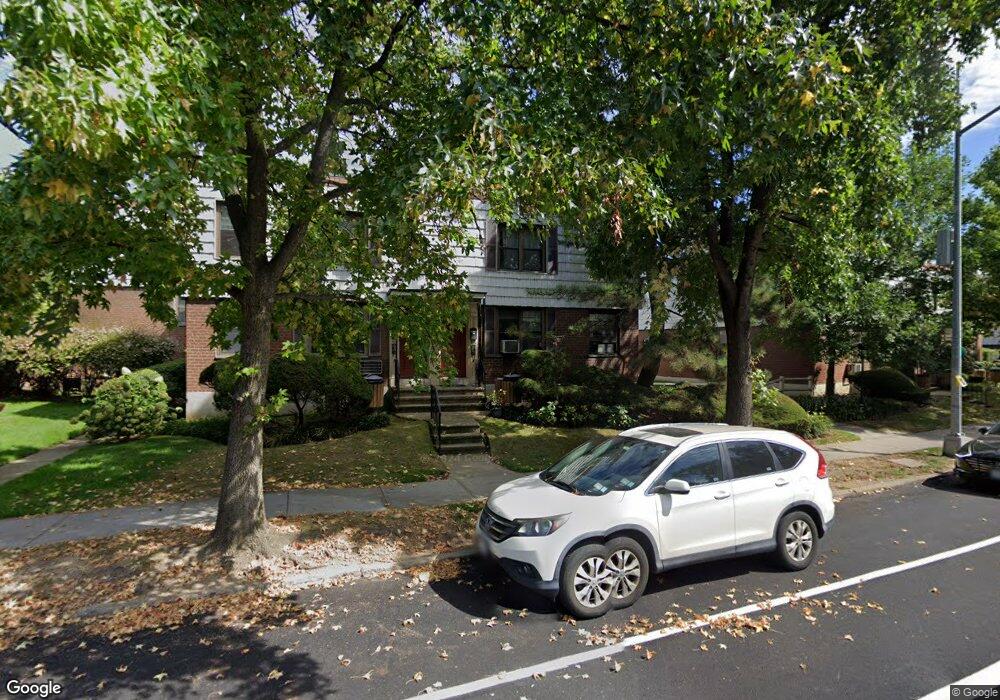
7055 Park Dr E Unit B Flushing, NY 11367
Kew Gardens Hills NeighborhoodEstimated Value: $376,712 - $663,000
Studio
--
Bath
635
Sq Ft
$737/Sq Ft
Est. Value
About This Home
This home is located at 7055 Park Dr E Unit B, Flushing, NY 11367 and is currently estimated at $467,928, approximately $736 per square foot. 7055 Park Dr E Unit B is a home located in Queens County with nearby schools including P.S. 164 - Queens Valley, I.S. 250 - The Robert F. Kennedy Community Middle School, and Yeshiva Of Central Queens.
Ownership History
Date
Name
Owned For
Owner Type
Purchase Details
Closed on
Nov 12, 2021
Sold by
Estate Of Rinil Routh and Subash Routh Administrator
Bought by
Routh Anita and Routh Subash
Current Estimated Value
Purchase Details
Closed on
Mar 22, 2018
Sold by
Routh Rinil
Bought by
Routh Anita and Routh Rinil
Home Financials for this Owner
Home Financials are based on the most recent Mortgage that was taken out on this home.
Original Mortgage
$250,000
Outstanding Balance
$211,727
Interest Rate
3.99%
Mortgage Type
New Conventional
Estimated Equity
$256,201
Purchase Details
Closed on
Feb 22, 2018
Sold by
Terrezza Mario and Terrezza Marisa
Bought by
Routh Rinil
Home Financials for this Owner
Home Financials are based on the most recent Mortgage that was taken out on this home.
Original Mortgage
$250,000
Outstanding Balance
$211,727
Interest Rate
3.99%
Mortgage Type
New Conventional
Estimated Equity
$256,201
Purchase Details
Closed on
Jan 24, 2008
Sold by
Lau Meimei
Bought by
Terrezza Mario and Terrezza Marisa
Create a Home Valuation Report for This Property
The Home Valuation Report is an in-depth analysis detailing your home's value as well as a comparison with similar homes in the area
Home Values in the Area
Average Home Value in this Area
Purchase History
| Date | Buyer | Sale Price | Title Company |
|---|---|---|---|
| Routh Anita | -- | -- | |
| Routh Anita | -- | -- | |
| Routh Rinil | $380,000 | -- | |
| Terrezza Mario | $270,000 | -- |
Source: Public Records
Mortgage History
| Date | Status | Borrower | Loan Amount |
|---|---|---|---|
| Open | Routh Rinil | $250,000 |
Source: Public Records
Tax History
| Year | Tax Paid | Tax Assessment Tax Assessment Total Assessment is a certain percentage of the fair market value that is determined by local assessors to be the total taxable value of land and additions on the property. | Land | Improvement |
|---|---|---|---|---|
| 2025 | $3,107 | $25,799 | $4,218 | $21,581 |
| 2024 | $3,107 | $24,849 | $4,218 | $20,631 |
| 2023 | $3,216 | $25,725 | $4,218 | $21,507 |
| 2022 | $3,109 | $25,572 | $4,218 | $21,354 |
| 2021 | $2,934 | $23,916 | $4,218 | $19,698 |
| 2020 | $2,933 | $26,974 | $4,218 | $22,756 |
| 2019 | $2,760 | $26,181 | $4,218 | $21,963 |
| 2018 | $2,597 | $20,419 | $4,218 | $16,201 |
| 2017 | $2,258 | $19,471 | $4,217 | $15,254 |
| 2016 | $2,124 | $19,471 | $4,217 | $15,254 |
| 2015 | $1,342 | $18,020 | $4,218 | $13,802 |
| 2014 | $1,342 | $17,148 | $4,208 | $12,940 |
Source: Public Records
Map
Nearby Homes
- 70-47 Park Dr E Unit A
- 70-43B Park Dr E
- 70-79 Park Dr E Unit B
- 69-92 136th St Unit A
- 7107 Park Dr E Unit B
- 71-17 Park Dr E Unit B
- 135-02 Jewel Ave Unit A
- 6951 136th St Unit 2A
- 71-43 Park Dr E Unit A
- 135-23 Jewel Ave Unit A
- 68-76 136th St Unit A
- 68-76 136th St Unit B
- 6860 136th St Unit A
- 136-59 Jewel Ave Unit A
- 68-38 136th St Unit A
- 69-15 136th St Unit A
- 138-01A Jewel Ave Unit 1A
- 67-89 136th St Unit A
- 6912 138th St Unit B
- 138-29 Jewel Ave Unit 3D
- 70-55 Park Dr E Unit 2R
- 7055 Park Dr E
- 7055 Park Dr E Unit A
- 7053 Park Dr E Unit B
- 7053 Park Dr E Unit A
- 70-55 Park Dr E
- 70-55 Park Dr E Unit 2
- 7055 Park Dr E Unit 2
- 7055 Park Dr E Unit 2
- 70-55 Park Dr E Unit 2nd Fl
- 7049 Park Dr E Unit B
- 7049 Park Dr E Unit A
- 7059 Park Dr E Unit B
- 7059 Park Dr E Unit A
- 7057 Park Dr E Unit B
- 7057A Park Dr E Unit A
- 7059 Park Dr E Unit 2n Fl.
- 7057 Park Dr E Unit 957B
- 7057 Park Dr E Unit B
- 7059 Park Dr E Unit B
Your Personal Tour Guide
Ask me questions while you tour the home.