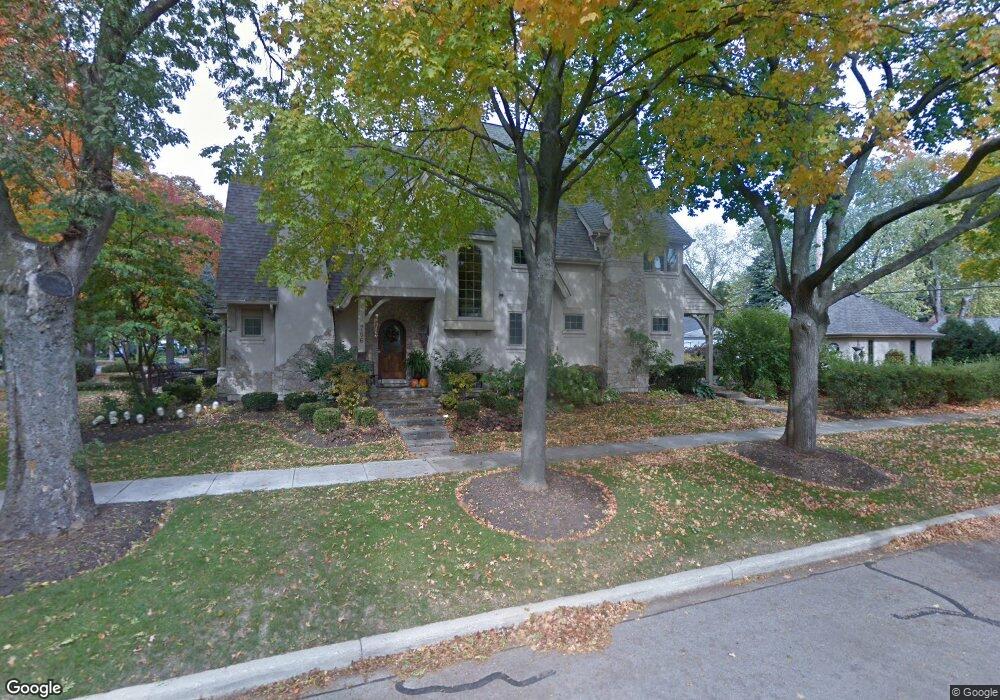
706 N Ellsworth St Naperville, IL 60563
North Downtown Naperville NeighborhoodEstimated Value: $1,261,599 - $1,763,000
--
Bed
1
Bath
3,647
Sq Ft
$406/Sq Ft
Est. Value
About This Home
This home is located at 706 N Ellsworth St, Naperville, IL 60563 and is currently estimated at $1,481,900, approximately $406 per square foot. 706 N Ellsworth St is a home located in DuPage County with nearby schools including Admiral Byrd Elementary School, Washington Jr High School, and Naperville North High School.
Ownership History
Date
Name
Owned For
Owner Type
Purchase Details
Closed on
Nov 10, 2003
Sold by
Steve Carr Builders Inc
Bought by
Oconnell James and Oconnell Vida
Current Estimated Value
Home Financials for this Owner
Home Financials are based on the most recent Mortgage that was taken out on this home.
Original Mortgage
$618,800
Outstanding Balance
$249,059
Interest Rate
4.12%
Mortgage Type
Purchase Money Mortgage
Estimated Equity
$1,232,841
Purchase Details
Closed on
Aug 30, 2001
Sold by
Graden Mark E and Graden Kathy J
Bought by
Steve Carr Builders Inc
Home Financials for this Owner
Home Financials are based on the most recent Mortgage that was taken out on this home.
Original Mortgage
$347,000
Interest Rate
7.03%
Purchase Details
Closed on
May 31, 1994
Sold by
Buikema Clarence J and Buikema Dorothy Mae
Bought by
Graden Mark E and Graden Kathy J
Home Financials for this Owner
Home Financials are based on the most recent Mortgage that was taken out on this home.
Original Mortgage
$148,500
Interest Rate
8.48%
Create a Home Valuation Report for This Property
The Home Valuation Report is an in-depth analysis detailing your home's value as well as a comparison with similar homes in the area
Home Values in the Area
Average Home Value in this Area
Purchase History
| Date | Buyer | Sale Price | Title Company |
|---|---|---|---|
| Oconnell James | $889,500 | Ctic | |
| Steve Carr Builders Inc | $322,000 | -- | |
| Graden Mark E | $165,000 | -- |
Source: Public Records
Mortgage History
| Date | Status | Borrower | Loan Amount |
|---|---|---|---|
| Open | Oconnell James | $618,800 | |
| Previous Owner | Steve Carr Builders Inc | $347,000 | |
| Previous Owner | Graden Mark E | $148,500 |
Source: Public Records
Tax History Compared to Growth
Tax History
| Year | Tax Paid | Tax Assessment Tax Assessment Total Assessment is a certain percentage of the fair market value that is determined by local assessors to be the total taxable value of land and additions on the property. | Land | Improvement |
|---|---|---|---|---|
| 2024 | $21,879 | $365,142 | $111,235 | $253,907 |
| 2023 | $21,134 | $333,250 | $101,520 | $231,730 |
| 2022 | $20,350 | $320,440 | $97,620 | $222,820 |
| 2021 | $19,624 | $308,320 | $93,930 | $214,390 |
| 2020 | $19,213 | $302,780 | $92,240 | $210,540 |
| 2019 | $18,672 | $289,680 | $88,250 | $201,430 |
| 2018 | $19,472 | $301,750 | $91,930 | $209,820 |
| 2017 | $19,097 | $291,570 | $88,830 | $202,740 |
| 2016 | $18,733 | $281,030 | $85,620 | $195,410 |
| 2015 | $18,645 | $264,650 | $80,630 | $184,020 |
| 2014 | $18,241 | $251,070 | $76,790 | $174,280 |
| 2013 | $17,966 | $251,670 | $76,970 | $174,700 |
Source: Public Records
Map
Nearby Homes
- 715 N Brainard St
- 719 N Brainard St
- 717 N Brainard St
- 837 N Loomis St
- 326 E 4th Ave
- 328 E 4th Ave
- 636 E 4th Ave
- 930 N Loomis St
- 316 N Loomis St
- 660 N Eagle St
- 905 N Webster St
- 1142 N Webster St
- 243 Box Car Ave
- 1016 N Mill St Unit 5
- 904 Coletta Cir
- 1104 N Mill St Unit 205
- 1310 Eagle St
- 5 N Columbia St
- 1314 N Eagle St
- 225 N Mill St
- 710 N Ellsworth St
- 716 N Ellsworth St
- 634 N Ellsworth St
- 720 N Ellsworth St
- 705 N Brainard St
- 709 N Brainard St
- 628 N Ellsworth St
- 726 N Ellsworth St
- 711 N Brainard St
- 240 E 7th Ave
- 240 E 7th Ave Unit 1
- 240 E 7th Ave Unit 3
- 240 E 7th Ave Unit 1B
- 240 E 7th Ave Unit 1A
- 705 N Ellsworth St
- 624 N Ellsworth St
- 717 N Ellsworth St
- 711 N Ellsworth St
- 633 N Ellsworth St
- 732 N Ellsworth St