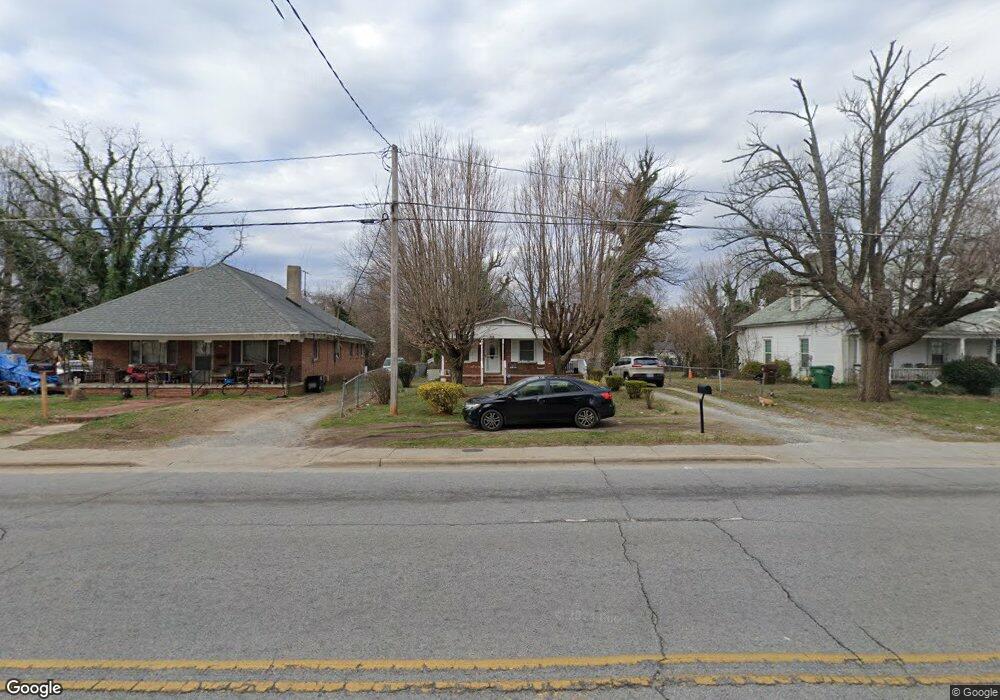
706 S Elm St High Point, NC 27260
Greater High Point NeighborhoodEstimated Value: $139,000 - $558,000
2
Beds
2
Baths
1,075
Sq Ft
$230/Sq Ft
Est. Value
About This Home
This home is located at 706 S Elm St, High Point, NC 27260 and is currently estimated at $247,473, approximately $230 per square foot. 706 S Elm St is a home located in Guilford County with nearby schools including Fairview Elementary School, Ferndale Middle School, and High Point Central High School.
Ownership History
Date
Name
Owned For
Owner Type
Purchase Details
Closed on
Dec 6, 2000
Sold by
Lindsay Mary Lue
Bought by
Harris Rich Elaine
Current Estimated Value
Purchase Details
Closed on
Aug 17, 2000
Sold by
Lue Lindsay Mary
Bought by
Lindsay Mary Lue and Harris Rich Elaine
Home Financials for this Owner
Home Financials are based on the most recent Mortgage that was taken out on this home.
Original Mortgage
$57,600
Interest Rate
11.25%
Create a Home Valuation Report for This Property
The Home Valuation Report is an in-depth analysis detailing your home's value as well as a comparison with similar homes in the area
Home Values in the Area
Average Home Value in this Area
Purchase History
| Date | Buyer | Sale Price | Title Company |
|---|---|---|---|
| Harris Rich Elaine | -- | -- | |
| Lindsay Mary Lue | -- | -- |
Source: Public Records
Mortgage History
| Date | Status | Borrower | Loan Amount |
|---|---|---|---|
| Previous Owner | Lindsay Mary Lue | $57,600 |
Source: Public Records
Tax History
| Year | Tax Paid | Tax Assessment Tax Assessment Total Assessment is a certain percentage of the fair market value that is determined by local assessors to be the total taxable value of land and additions on the property. | Land | Improvement |
|---|---|---|---|---|
| 2025 | $940 | $68,200 | $12,000 | $56,200 |
| 2024 | $940 | $68,200 | $12,000 | $56,200 |
| 2023 | $940 | $68,200 | $12,000 | $56,200 |
| 2022 | $919 | $68,200 | $12,000 | $56,200 |
| 2021 | $785 | $57,000 | $8,500 | $48,500 |
| 2020 | $785 | $57,000 | $8,500 | $48,500 |
| 2019 | $785 | $57,000 | $0 | $0 |
| 2018 | $782 | $57,000 | $0 | $0 |
| 2017 | $785 | $57,000 | $0 | $0 |
| 2016 | $797 | $56,800 | $0 | $0 |
| 2015 | $801 | $56,800 | $0 | $0 |
| 2014 | $815 | $56,800 | $0 | $0 |
Source: Public Records
Map
Nearby Homes
- 616 S Elm St
- 405 W Willis Ave
- 407 W Willis Ave
- 308 W Kearns Ave
- 1217 Cloverdale St
- 537 Flint Ave
- 1213 S Elm St
- 1410 Cloverdale St
- 323 Coltrane Ave
- 703 Langford Ave
- 1504 Cloverdale St
- 527 Amos St
- 525 Amos St
- 812 Tryon Ave
- 816 Tryon Ave
- 702 Park St
- 1015 Sharon St
- 925 Randolph St
- 328 Ennis St
- 4304 Griffins Gate Ln
Your Personal Tour Guide
Ask me questions while you tour the home.