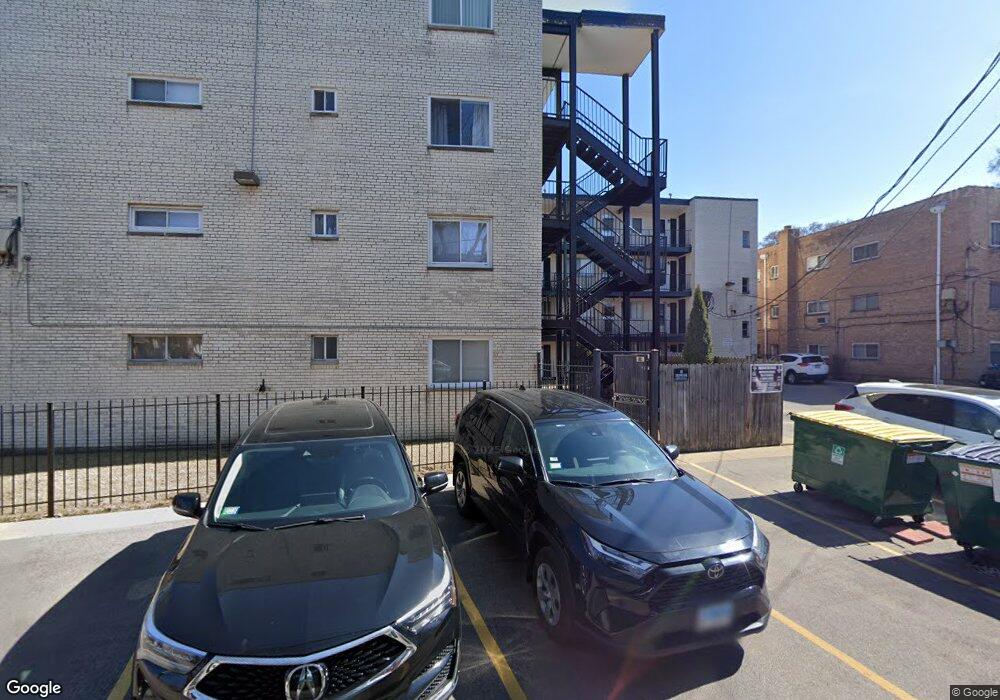
7074 N Ridge Blvd Unit 1A Chicago, IL 60645
West Ridge NeighborhoodEstimated Value: $183,000 - $209,325
2
Beds
1
Bath
24,300
Sq Ft
$8/Sq Ft
Est. Value
About This Home
This home is located at 7074 N Ridge Blvd Unit 1A, Chicago, IL 60645 and is currently estimated at $191,831, approximately $7 per square foot. 7074 N Ridge Blvd Unit 1A is a home located in Cook County with nearby schools including George Armstrong Elementary School, Sullivan High School, and Acero - Sor Juana Ines de la Cruz School.
Ownership History
Date
Name
Owned For
Owner Type
Purchase Details
Closed on
Feb 28, 2000
Sold by
Guillu Maria D C and Guillu Linda M
Bought by
Smagacz Peter and Smagacz Margie
Current Estimated Value
Home Financials for this Owner
Home Financials are based on the most recent Mortgage that was taken out on this home.
Original Mortgage
$81,700
Interest Rate
8.14%
Purchase Details
Closed on
Nov 23, 1999
Sold by
Guillu Bruno E and Guillu Criselda
Bought by
Guillu Maria D C and Guillu Linda M
Purchase Details
Closed on
Aug 1, 1996
Sold by
Berglund Jean and Bell Joan
Bought by
Guillu Bruno E and Martinez Criselda
Home Financials for this Owner
Home Financials are based on the most recent Mortgage that was taken out on this home.
Original Mortgage
$53,675
Interest Rate
8.33%
Create a Home Valuation Report for This Property
The Home Valuation Report is an in-depth analysis detailing your home's value as well as a comparison with similar homes in the area
Home Values in the Area
Average Home Value in this Area
Purchase History
| Date | Buyer | Sale Price | Title Company |
|---|---|---|---|
| Smagacz Peter | $86,000 | -- | |
| Guillu Maria D C | -- | -- | |
| Guillu Bruno E | $56,500 | 1St American Title |
Source: Public Records
Mortgage History
| Date | Status | Borrower | Loan Amount |
|---|---|---|---|
| Previous Owner | Smagacz Peter | $81,700 | |
| Previous Owner | Guillu Bruno E | $53,675 |
Source: Public Records
Tax History Compared to Growth
Tax History
| Year | Tax Paid | Tax Assessment Tax Assessment Total Assessment is a certain percentage of the fair market value that is determined by local assessors to be the total taxable value of land and additions on the property. | Land | Improvement |
|---|---|---|---|---|
| 2024 | $2,465 | $18,560 | $2,087 | $16,473 |
| 2023 | $2,382 | $15,000 | $1,670 | $13,330 |
| 2022 | $2,382 | $15,000 | $1,670 | $13,330 |
| 2021 | $2,346 | $14,999 | $1,669 | $13,330 |
| 2020 | $471 | $5,218 | $1,576 | $3,642 |
| 2019 | $474 | $5,789 | $1,576 | $4,213 |
| 2018 | $465 | $5,789 | $1,576 | $4,213 |
| 2017 | $690 | $6,580 | $1,391 | $5,189 |
| 2016 | $818 | $6,580 | $1,391 | $5,189 |
| 2015 | $725 | $6,580 | $1,391 | $5,189 |
| 2014 | $1,356 | $9,876 | $1,252 | $8,624 |
| 2013 | $1,318 | $9,876 | $1,252 | $8,624 |
Source: Public Records
Map
Nearby Homes
- 7074 N Ridge Blvd Unit 1E
- 7070 N Ridge Blvd Unit 1A
- 2101 W Greenleaf Ave
- 7019 N Ridge Blvd Unit 3B
- 7019 N Ridge Blvd Unit 3A
- 7102 N Damen Ave Unit 3
- 7228 N Rogers Ave
- 2175 W Touhy Ave
- 7207 N Damen Ave Unit 2
- 7234 N Hamilton Ave
- 6959 N Ridge Blvd Unit 1C
- 7223 N Damen Ave
- 2036 W Morse Ave Unit D
- 7227 N Damen Ave
- 2224 W Touhy Ave Unit 3N
- 1958 W Morse Ave Unit B
- 7223 N Oakley Ave Unit 1E
- 7252 N Bell Ave
- 7129 N Oakley Ave
- 2109 W Jarvis Ave Unit 1
- 7074 N Ridge Blvd Unit 4E
- 7074 N Ridge Blvd Unit 3A
- 7074 N Ridge Blvd Unit 3C
- 7074 N Ridge Blvd Unit 3B
- 7074 N Ridge Blvd Unit 2B
- 7074 N Ridge Blvd Unit 1B
- 7074 N Ridge Blvd Unit 3E
- 7074 N Ridge Blvd Unit 4A
- 7074 N Ridge Blvd Unit 4D
- 7074 N Ridge Blvd Unit 4B
- 7074 N Ridge Blvd Unit 3D
- 7074 N Ridge Blvd Unit 4C
- 7074 N Ridge Blvd Unit 2E
- 7074 N Ridge Blvd Unit 2D
- 7074 N Ridge Blvd Unit 2A
- 7074 N Ridge Blvd Unit 1D
- 7074 N Ridge Blvd Unit 1D
- 7074 N Ridge Blvd Unit 3D
- 7070 N Ridge Blvd Unit P6
- 7070 N Ridge Blvd Unit P7