7075 Dice Lampley Rd Fairview, TN 37062
Estimated Value: $337,000 - $413,000
Studio
2
Baths
1,225
Sq Ft
$309/Sq Ft
Est. Value
About This Home
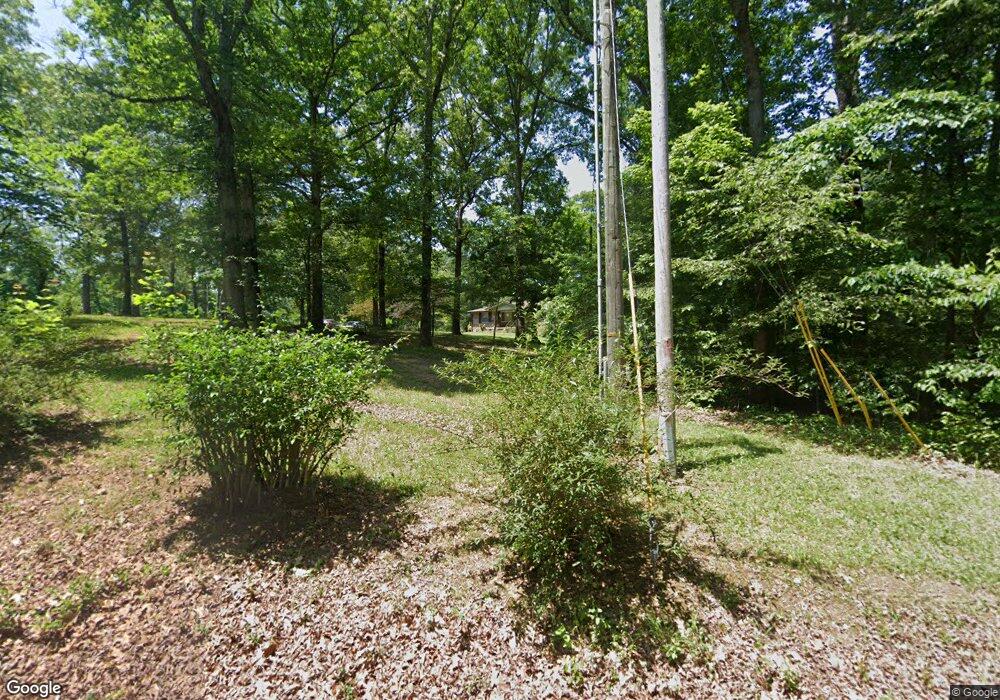
This home is located at 7075 Dice Lampley Rd, Fairview, TN 37062 and is currently estimated at $379,133, approximately $309 per square foot. 7075 Dice Lampley Rd is a home located in Williamson County with nearby schools including Fairview Elementary School, Fairview Middle School, and Fairview High School.
Ownership History
Date
Name
Owned For
Owner Type
Purchase Details
Closed on
Apr 29, 2019
Sold by
Mcbroom L Elizabeth Karachelle and Mcbroom Dubose Erin Karmalee
Bought by
Dubose Joseph D and Dubose Erin
Current Estimated Value
Home Financials for this Owner
Home Financials are based on the most recent Mortgage that was taken out on this home.
Original Mortgage
$89,540
Outstanding Balance
$79,223
Interest Rate
4.62%
Mortgage Type
FHA
Estimated Equity
$299,910
Purchase Details
Closed on
May 16, 2018
Sold by
Mcbroom Lincoln Elizabeth Karachelle and Mcbroom Erin Karmalee
Bought by
Chapman Dennis and Chapman Charlene
Purchase Details
Closed on
Sep 8, 2006
Sold by
Stinson John W and Stinson Linda
Bought by
Mcbroom Kathy L
Purchase Details
Closed on
Aug 1, 2006
Sold by
Tate Cynthia Dawn
Bought by
Stinson John W and Stinson Linda
Purchase Details
Closed on
Sep 10, 1999
Sold by
Teasley Katherine Perkins and Teasley Elton
Bought by
Tate Norman B and Tate Cynthia D
Home Financials for this Owner
Home Financials are based on the most recent Mortgage that was taken out on this home.
Original Mortgage
$114,000
Interest Rate
7.62%
Create a Home Valuation Report for This Property
The Home Valuation Report is an in-depth analysis detailing your home's value as well as a comparison with similar homes in the area
Home Values in the Area
Average Home Value in this Area
Purchase History
| Date | Buyer | Sale Price | Title Company |
|---|---|---|---|
| Dubose Joseph D | $225,000 | Brentwood Title & Escrow | |
| Chapman Dennis | $147,000 | Bankers Title & Escrow Dicks | |
| Mcbroom Kathy L | $115,000 | None Available | |
| Stinson John W | $89,305 | None Available | |
| Tate Norman B | $120,000 | -- |
Source: Public Records
Mortgage History
| Date | Status | Borrower | Loan Amount |
|---|---|---|---|
| Open | Dubose Joseph D | $89,540 | |
| Previous Owner | Tate Norman B | $114,000 |
Source: Public Records
Tax History
| Year | Tax Paid | Tax Assessment Tax Assessment Total Assessment is a certain percentage of the fair market value that is determined by local assessors to be the total taxable value of land and additions on the property. | Land | Improvement |
|---|---|---|---|---|
| 2025 | $1,063 | $82,425 | $34,275 | $48,150 |
| 2024 | $1,063 | $56,525 | $17,125 | $39,400 |
| 2023 | $1,063 | $56,525 | $17,125 | $39,400 |
| 2022 | $1,063 | $56,525 | $17,125 | $39,400 |
| 2021 | $1,063 | $56,525 | $17,125 | $39,400 |
| 2020 | $879 | $39,600 | $8,500 | $31,100 |
| 2019 | $879 | $39,600 | $8,500 | $31,100 |
| 2018 | $851 | $39,600 | $8,500 | $31,100 |
| 2017 | $851 | $39,600 | $8,500 | $31,100 |
Source: Public Records
Map
Nearby Homes
- 7164 Dice Lampley Rd
- 0 Dice Lampley Rd
- 7449 Crow Cut Rd
- 7708 Woodford Dr
- 7194 Dice Lampley Rd
- 7925 Pine St
- 7930 Pine St
- 7914 Pine St
- 7912 Pine St
- 7322 Buckhorn Ct
- 7904 Pine St
- 7910 Pine St
- 7343 Buckhorn Ct
- 7338 Buckhorn Ct
- 7324 Buckhorn Ct
- 7336 Buckhorn Ct
- 7326 Buckhorn Ct
- 7404 Black Fox Dr
- 7208 Adenborough Dr
- 7406 Black Fox Dr
- 7105 Dice Lampley Rd
- 7065 Dice Lampley Rd
- 7138 Dice Lampley Rd
- 2958 Pine St
- 7152 Dice Lampley Rd
- 7476 Crow Cut Rd
- 7470 Crow Cut Rd
- 7474 Crow Cut Rd
- 7160 Dice Lampley Rd
- 7149 Dice Lampley Rd
- 7481 Crow Cut Rd
- 7156 Dice Lampley Rd
- 7475 Crow Cut Rd
- 7168 Dice Lampley Rd
- 7467 Crow Cut Rd
- 7511 Crow Cut Rd
- 7135 Dice Lampley Rd
- 0 Crow Cut Rd Unit 1601137
- 0 Crow Cut Rd Unit 1805482
- 0 Crow Cut Rd Unit RTC2931881
Your Personal Tour Guide
Ask me questions while you tour the home.