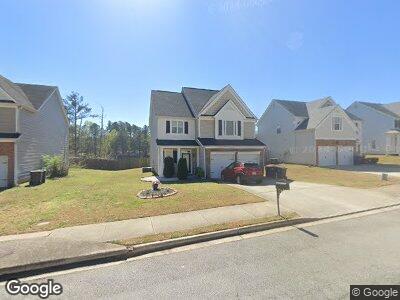
7075 Littlebrook Way Douglasville, GA 30134
Estimated Value: $282,406 - $337,000
3
Beds
3
Baths
1,896
Sq Ft
$159/Sq Ft
Est. Value
About This Home
This home is located at 7075 Littlebrook Way, Douglasville, GA 30134 and is currently estimated at $302,102, approximately $159 per square foot. 7075 Littlebrook Way is a home located in Douglas County with nearby schools including North Douglas Elementary School, Stewart Middle School, and Douglas County High School.
Ownership History
Date
Name
Owned For
Owner Type
Purchase Details
Closed on
Dec 23, 2019
Sold by
Duah Isaac Agyemang
Bought by
Daniels Hazel Yolanda and Bell Natalie Roslyn
Current Estimated Value
Home Financials for this Owner
Home Financials are based on the most recent Mortgage that was taken out on this home.
Original Mortgage
$177,721
Outstanding Balance
$164,277
Interest Rate
5.12%
Mortgage Type
FHA
Estimated Equity
$143,164
Purchase Details
Closed on
May 26, 2010
Sold by
Hsi Asset 2007-He1
Bought by
Duah Isaac A
Home Financials for this Owner
Home Financials are based on the most recent Mortgage that was taken out on this home.
Original Mortgage
$94,724
Interest Rate
5.25%
Mortgage Type
FHA
Purchase Details
Closed on
Dec 1, 2009
Sold by
Loriston Roguens
Bought by
Hsi Asset Trust 2007-He1
Create a Home Valuation Report for This Property
The Home Valuation Report is an in-depth analysis detailing your home's value as well as a comparison with similar homes in the area
Home Values in the Area
Average Home Value in this Area
Purchase History
| Date | Buyer | Sale Price | Title Company |
|---|---|---|---|
| Daniels Hazel Yolanda | $181,000 | -- | |
| Duah Isaac A | $96,000 | -- | |
| Hsi Asset Trust 2007-He1 | $103,500 | -- |
Source: Public Records
Mortgage History
| Date | Status | Borrower | Loan Amount |
|---|---|---|---|
| Open | Daniels Hazel Yolanda | $47,902 | |
| Open | Daniels Hazel Yolanda | $177,721 | |
| Previous Owner | Duah Isaac Agyemang | $92,200 | |
| Previous Owner | Duah Isaac A | $94,724 |
Source: Public Records
Tax History Compared to Growth
Tax History
| Year | Tax Paid | Tax Assessment Tax Assessment Total Assessment is a certain percentage of the fair market value that is determined by local assessors to be the total taxable value of land and additions on the property. | Land | Improvement |
|---|---|---|---|---|
| 2024 | $4,304 | $103,560 | $20,000 | $83,560 |
| 2023 | $4,304 | $85,000 | $16,000 | $69,000 |
| 2022 | $3,448 | $85,000 | $16,000 | $69,000 |
| 2021 | $2,582 | $63,400 | $10,360 | $53,040 |
| 2020 | $2,559 | $61,680 | $10,360 | $51,320 |
| 2019 | $2,078 | $60,320 | $10,360 | $49,960 |
| 2018 | $2,013 | $57,560 | $10,120 | $47,440 |
| 2017 | $1,987 | $55,240 | $10,800 | $44,440 |
| 2016 | $1,814 | $49,360 | $8,000 | $41,360 |
| 2015 | $1,217 | $42,640 | $7,120 | $35,520 |
| 2014 | $1,217 | $32,400 | $5,200 | $27,200 |
| 2013 | -- | $28,880 | $5,200 | $23,680 |
Source: Public Records
Map
Nearby Homes
- 8220 Chicago Ave
- 8224 Chicago Ave
- 8216 Chicago Ave
- 8212 Chicago Ave
- 8208 Chicago Ave
- 8260 Chicago Ave
- 7104 Skippingstone Way
- 8072 Crystal Ln
- 7268 Westwood Ln
- 8553 Braylen Manor Dr
- 7125 Crystal Creek Place
- 8005 Big Rock Dr
- 7128 Crystal Creek Place
- 8659 Paradise Dr
- 6886 Upshaw Mill Rd
- 6861 John Clark Dr
- 7847 Dogwood Way
- 8006 Bradshaw Ct Unit 2
- 7075 Littlebrook Way
- 7077 Littlebrook Way Unit 1
- 7073 Littlebrook Way
- 0 Littlebrook Way Unit 8660703
- 0 Littlebrook Way Unit 8621207
- 0 Littlebrook Way Unit 8524714
- 0 Littlebrook Way Unit 3235647
- 0 Littlebrook Way Unit 7176850
- 0 Littlebrook Way Unit 3268673
- 0 Littlebrook Way Unit 7160918
- 0 Littlebrook Way Unit 8569351
- 0 Littlebrook Way Unit 8897365
- 0 Littlebrook Way Unit 8020101
- 0 Littlebrook Way Unit 7323239
- 0 Littlebrook Way Unit 7315124
- 0 Littlebrook Way Unit 7265211
- 0 Littlebrook Way Unit 7220999
- 0 Littlebrook Way Unit 7077294
- 0 Littlebrook Way Unit 7015488
- 0 Littlebrook Way Unit 9017999