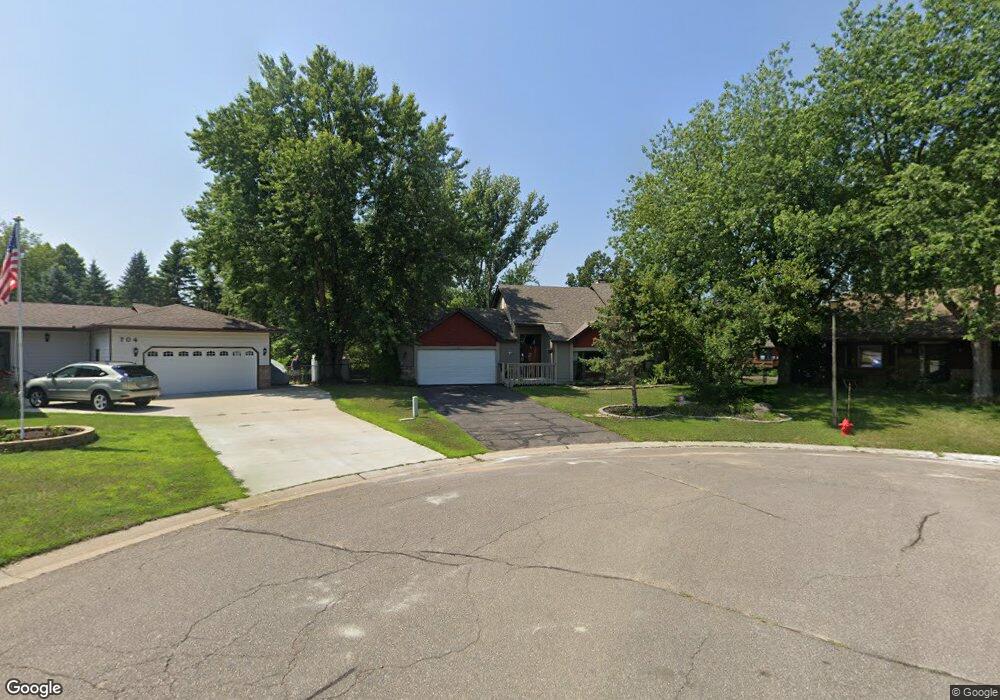
708 Calvin Ct Saint Paul, MN 55123
Estimated Value: $429,000 - $462,037
3
Beds
2
Baths
2,112
Sq Ft
$212/Sq Ft
Est. Value
About This Home
This home is located at 708 Calvin Ct, Saint Paul, MN 55123 and is currently estimated at $446,759, approximately $211 per square foot. 708 Calvin Ct is a home located in Dakota County with nearby schools including Pinewood Elementary School, Dakota Hills Middle School, and Eagan Senior High School.
Ownership History
Date
Name
Owned For
Owner Type
Purchase Details
Closed on
Dec 23, 2021
Sold by
Rowen Robert L Mirto and Rowen Melinda M
Bought by
Rother Amy and Rother Peter John
Current Estimated Value
Home Financials for this Owner
Home Financials are based on the most recent Mortgage that was taken out on this home.
Original Mortgage
$394,250
Outstanding Balance
$361,971
Interest Rate
2.98%
Mortgage Type
New Conventional
Estimated Equity
$84,788
Purchase Details
Closed on
Aug 30, 2019
Sold by
Ringkob Sandra R Pearson
Bought by
Rowen Robert L Mirto and Rowen Melinda M Mirto
Home Financials for this Owner
Home Financials are based on the most recent Mortgage that was taken out on this home.
Original Mortgage
$310,650
Interest Rate
3.6%
Mortgage Type
New Conventional
Purchase Details
Closed on
Aug 23, 2000
Sold by
Kriva Thomas B and Kriva Tamara L
Bought by
Ringkob Douglas and Ringkob Sandra
Purchase Details
Closed on
Feb 27, 1998
Sold by
Berglund Julie
Bought by
Kriva Thomas B and Kriva Tamara L
Create a Home Valuation Report for This Property
The Home Valuation Report is an in-depth analysis detailing your home's value as well as a comparison with similar homes in the area
Home Values in the Area
Average Home Value in this Area
Purchase History
| Date | Buyer | Sale Price | Title Company |
|---|---|---|---|
| Rother Amy | $422,500 | Legacy Title | |
| Rowen Robert L Mirto | $327,000 | Burnet Title | |
| Ringkob Douglas | $208,900 | -- | |
| Kriva Thomas B | $142,000 | -- |
Source: Public Records
Mortgage History
| Date | Status | Borrower | Loan Amount |
|---|---|---|---|
| Open | Rother Amy | $394,250 | |
| Previous Owner | Rowen Robert L Mirto | $310,650 |
Source: Public Records
Tax History Compared to Growth
Tax History
| Year | Tax Paid | Tax Assessment Tax Assessment Total Assessment is a certain percentage of the fair market value that is determined by local assessors to be the total taxable value of land and additions on the property. | Land | Improvement |
|---|---|---|---|---|
| 2024 | $4,378 | $403,100 | $111,100 | $292,000 |
| 2023 | $4,378 | $403,700 | $111,400 | $292,300 |
| 2022 | $3,936 | $401,700 | $111,100 | $290,600 |
| 2021 | $3,720 | $354,000 | $96,600 | $257,400 |
| 2020 | $3,666 | $328,400 | $92,000 | $236,400 |
| 2019 | $3,281 | $315,800 | $85,700 | $230,100 |
| 2018 | $3,289 | $299,600 | $81,600 | $218,000 |
| 2017 | $3,212 | $274,200 | $77,800 | $196,400 |
| 2016 | $3,178 | $256,100 | $74,000 | $182,100 |
| 2015 | $3,060 | $236,350 | $69,681 | $166,669 |
| 2014 | -- | $230,137 | $67,549 | $162,588 |
| 2013 | -- | $203,868 | $60,276 | $143,592 |
Source: Public Records
Map
Nearby Homes
- 699 Calvin Ct
- 681 Summer Ln
- 4358 Yorktown Dr
- 4231 Yorktown Dr
- 4274 Maclaren Place
- 782 Summerbrooke Ct
- 790 Summerbrooke Ct
- 591 Autumn Oaks Ct
- 4240 Braddock Trail
- 4125 Pennsylvania Ave
- 4080 Camberwell Dr N
- 4162 Pennsylvania Ave
- 4027 Camberwell Dr N
- 4072 Prairie Ridge Rd
- 4525 Alicia Dr
- 4124 New York Ave
- 878 Lakewood Hills Rd S
- 10787 Alison Way
- 4001 Haven Woods Ct
- 10668 Alton Ct
- 704 Calvin Ct
- 711 Calvin Ct
- 4332 Stirrup St
- 4342 Stirrup St
- 700 Calvin Ct
- 4322 Stirrup St
- 4352 Stirrup St
- 707 Calvin Ct
- 703 Calvin Ct
- 745 Golden Meadow Rd
- 735 Golden Meadow Rd
- 731 Golden Meadow Rd
- 4312 Stirrup St
- 4362 Stirrup St
- 746 Hackmore Dr
- 740 Hackmore Dr
- 4341 Stirrup St
- 730 Hackmore Dr
- 4321 Stirrup St
- 4351 Stirrup St