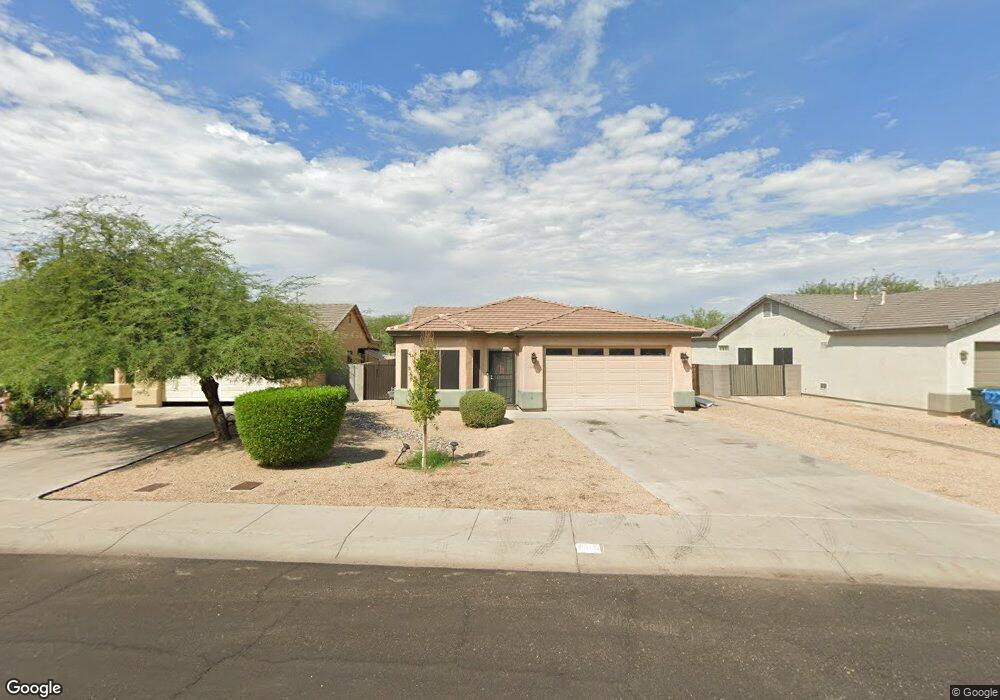
708 E Carson Rd Phoenix, AZ 85042
South Mountain NeighborhoodEstimated Value: $367,000 - $402,000
3
Beds
2
Baths
1,974
Sq Ft
$192/Sq Ft
Est. Value
About This Home
This home is located at 708 E Carson Rd, Phoenix, AZ 85042 and is currently estimated at $379,785, approximately $192 per square foot. 708 E Carson Rd is a home located in Maricopa County with nearby schools including John F. Kennedy Elementary School, C O Greenfield School, and South Mountain High School.
Ownership History
Date
Name
Owned For
Owner Type
Purchase Details
Closed on
Nov 26, 2018
Sold by
Ramaiah Shantala V and The Arbic Ramaiah Living Trust
Bought by
Castro Alcides Moises and Castro Elena Del Carmen
Current Estimated Value
Home Financials for this Owner
Home Financials are based on the most recent Mortgage that was taken out on this home.
Original Mortgage
$209,700
Outstanding Balance
$184,750
Interest Rate
4.8%
Mortgage Type
New Conventional
Estimated Equity
$195,035
Purchase Details
Closed on
Aug 10, 2013
Sold by
Arbic Joel B and Ramaish Shantala V
Bought by
Arbic Joel B and Ramaiah Shantala
Purchase Details
Closed on
Aug 7, 2013
Sold by
Arbic Joel B
Bought by
Arbic Joel B and Ramaiah Shantala
Purchase Details
Closed on
Nov 6, 2003
Sold by
Arlington Custom Homes Inc
Bought by
Arbic Joel B
Home Financials for this Owner
Home Financials are based on the most recent Mortgage that was taken out on this home.
Original Mortgage
$170,800
Interest Rate
5.87%
Mortgage Type
Stand Alone Second
Create a Home Valuation Report for This Property
The Home Valuation Report is an in-depth analysis detailing your home's value as well as a comparison with similar homes in the area
Home Values in the Area
Average Home Value in this Area
Purchase History
| Date | Buyer | Sale Price | Title Company |
|---|---|---|---|
| Castro Alcides Moises | $233,000 | Driggs Title Agency Inc | |
| Arbic Joel B | -- | None Available | |
| Arbic Joel B | -- | None Available | |
| Arbic Joel B | $213,500 | Fidelity National Title |
Source: Public Records
Mortgage History
| Date | Status | Borrower | Loan Amount |
|---|---|---|---|
| Open | Castro Alcides Moises | $209,700 | |
| Previous Owner | Arbic Joel B | $170,800 |
Source: Public Records
Tax History
| Year | Tax Paid | Tax Assessment Tax Assessment Total Assessment is a certain percentage of the fair market value that is determined by local assessors to be the total taxable value of land and additions on the property. | Land | Improvement |
|---|---|---|---|---|
| 2025 | $1,665 | $11,044 | -- | -- |
| 2024 | $1,576 | $10,518 | -- | -- |
| 2023 | $1,576 | $30,180 | $6,030 | $24,150 |
| 2022 | $1,544 | $23,970 | $4,790 | $19,180 |
| 2021 | $1,576 | $21,050 | $4,210 | $16,840 |
| 2020 | $1,556 | $20,030 | $4,000 | $16,030 |
| 2019 | $1,506 | $17,130 | $3,420 | $13,710 |
| 2018 | $1,466 | $15,150 | $3,030 | $12,120 |
| 2017 | $1,397 | $12,280 | $2,450 | $9,830 |
| 2016 | $1,329 | $12,030 | $2,400 | $9,630 |
| 2015 | $1,251 | $10,170 | $2,030 | $8,140 |
Source: Public Records
Map
Nearby Homes
- 819 E Apollo Rd
- 913 E Fremont Rd Unit 1
- 333 E Carter Rd
- 825 E Minton St
- 6410 S 7th St
- 6630 S 11th St Unit 1
- 21 E Saint Charles Ave
- 849 E Constance Way
- 1329 E Irwin Ave
- 916 E Harwell Rd
- 29 E Baseline Rd
- 506 E Southern Ave
- 7312 S 13th Way
- 301 E Southern Ave
- 18 E Valencia Dr
- 836 E Gary Ln
- 17 W Alta Vista Rd
- 111 E Southern Ave
- 7203 S 2nd Ln
- 7527 S 13th Place
- 712 E Carson Rd
- 704 E Carson Rd
- 716 E Carson Rd
- 720 E Carson Rd
- 724 E Carson Rd
- 709 E Carson Rd
- 705 E Carson Rd
- 713 E Carson Rd
- 551 E Greenway Rd
- 717 E Carson Rd
- 728 E Carson Rd
- 721 E Carson Rd
- 725 E Carson Rd
- 6848 S 7th St
- 541 E Greenway Rd
- 732 E Carson Rd
- 729 E Carson Rd Unit 11
- 729 E Carson Rd
- 708 E Carter Rd
- 702 E Carter Rd
Your Personal Tour Guide
Ask me questions while you tour the home.