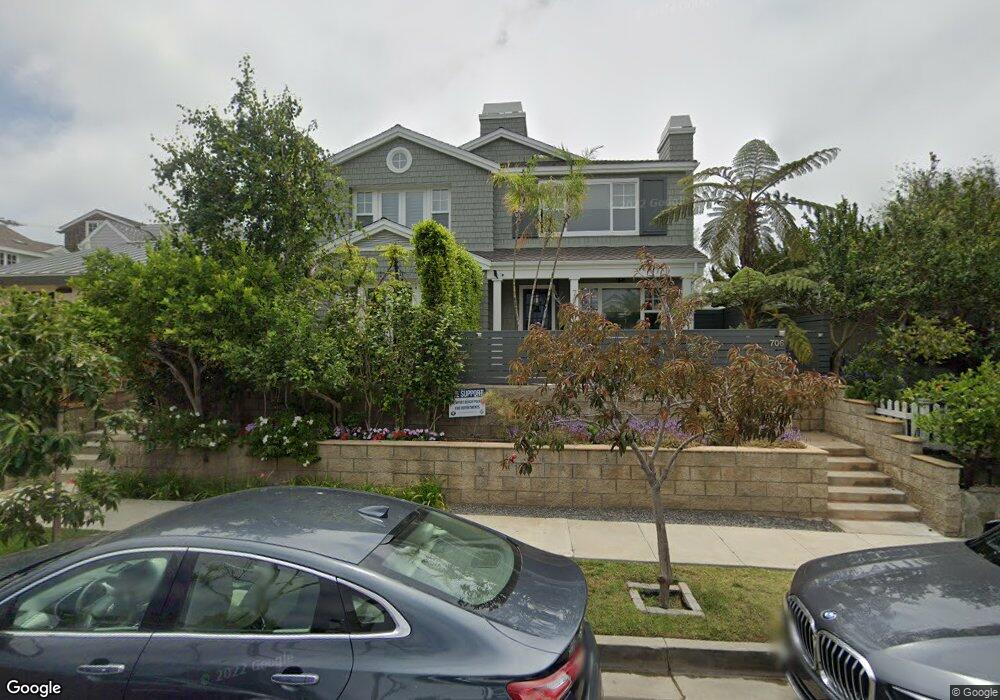
708 Jasmine Ave Unit 2 Corona Del Mar, CA 92625
Corona Del Mar NeighborhoodEstimated Value: $3,108,000 - $3,670,000
4
Beds
3
Baths
2,406
Sq Ft
$1,407/Sq Ft
Est. Value
About This Home
This home is located at 708 Jasmine Ave Unit 2, Corona Del Mar, CA 92625 and is currently estimated at $3,385,819, approximately $1,407 per square foot. 708 Jasmine Ave Unit 2 is a home located in Orange County with nearby schools including Harbor View Elementary School, Corona del Mar Middle and High School, and Harbor Day School.
Ownership History
Date
Name
Owned For
Owner Type
Purchase Details
Closed on
May 13, 2002
Sold by
Ferguson/Day Properties Llc
Bought by
Strauss Kenard G and Strauss Boots
Current Estimated Value
Home Financials for this Owner
Home Financials are based on the most recent Mortgage that was taken out on this home.
Original Mortgage
$732,000
Outstanding Balance
$308,226
Interest Rate
6.89%
Estimated Equity
$3,077,593
Purchase Details
Closed on
Sep 7, 2000
Sold by
Day Jeffrey
Bought by
Mckay Kimberly A
Purchase Details
Closed on
Apr 27, 2000
Sold by
Day Jeffrey
Bought by
Mckay Kimberly A
Home Financials for this Owner
Home Financials are based on the most recent Mortgage that was taken out on this home.
Original Mortgage
$548,000
Interest Rate
8.53%
Create a Home Valuation Report for This Property
The Home Valuation Report is an in-depth analysis detailing your home's value as well as a comparison with similar homes in the area
Home Values in the Area
Average Home Value in this Area
Purchase History
| Date | Buyer | Sale Price | Title Company |
|---|---|---|---|
| Strauss Kenard G | $915,000 | Fidelity National Title Co | |
| Mckay Kimberly A | -- | Fidelity National Title Co | |
| Mckay Kimberly A | -- | Chicago Title Co | |
| Mckay Kimberly A | $685,000 | Chicago Title Co |
Source: Public Records
Mortgage History
| Date | Status | Borrower | Loan Amount |
|---|---|---|---|
| Open | Strauss Kenard G | $732,000 | |
| Previous Owner | Mckay Kimberly A | $548,000 |
Source: Public Records
Tax History Compared to Growth
Tax History
| Year | Tax Paid | Tax Assessment Tax Assessment Total Assessment is a certain percentage of the fair market value that is determined by local assessors to be the total taxable value of land and additions on the property. | Land | Improvement |
|---|---|---|---|---|
| 2025 | $14,506 | $1,376,840 | $988,606 | $388,234 |
| 2024 | $14,506 | $1,349,844 | $969,222 | $380,622 |
| 2023 | $14,163 | $1,323,377 | $950,218 | $373,159 |
| 2022 | $13,925 | $1,297,429 | $931,586 | $365,843 |
| 2021 | $13,658 | $1,271,990 | $913,320 | $358,670 |
| 2020 | $13,525 | $1,258,948 | $903,955 | $354,993 |
| 2019 | $13,247 | $1,234,263 | $886,230 | $348,033 |
| 2018 | $12,982 | $1,210,062 | $868,853 | $341,209 |
| 2017 | $12,752 | $1,186,336 | $851,817 | $334,519 |
| 2016 | $12,465 | $1,163,075 | $835,115 | $327,960 |
| 2015 | $12,346 | $1,145,605 | $822,571 | $323,034 |
| 2014 | $12,054 | $1,123,165 | $806,458 | $316,707 |
Source: Public Records
Map
Nearby Homes
- 3201 4th Ave
- 613 Larkspur Ave
- 603 Larkspur Ave
- 611 .5 Jasmine Ave
- 714 1/2 Iris Ave
- 618 Iris Ave Unit B
- 712 Marguerite Ave
- 516 Larkspur Ave
- 516 Iris Ave
- 514 Iris Ave
- 708 Heliotrope Ave
- 502 Jasmine Ave Unit A
- 3401 5th Ave
- 505 1/2 Marigold Ave
- 512 Marigold Ave
- 426 Marguerite Ave
- 603 .5 Larkspur Ave
- 616 Narcissus Ave
- 516 1/2 Larkspur (Rear Home) Ave
- 3510 Lilac Ave Unit 13
- 706 Jasmine Ave Unit 1
- 710 Jasmine Ave Unit B
- 710 Jasmine Ave
- 704 Jasmine Ave
- 712 Jasmine Ave
- 702 Jasmine Ave
- 714 Jasmine Ave Unit 1/2
- 714 Jasmine Ave
- 700 1/2 Jasmine Ave
- 707 Larkspur Ave Unit A
- 707 Larkspur Ave Unit front
- 707 Larkspur Ave Unit 1/2
- 707 Larkspur Ave
- 716 Jasmine Ave
- 709 Larkspur Ave Unit B
- 709 Larkspur Ave
- 711 Larkspur Ave
- 705 Larkspur Ave Unit B
- 705 Larkspur Ave
- 713 Larkspur Ave Unit B