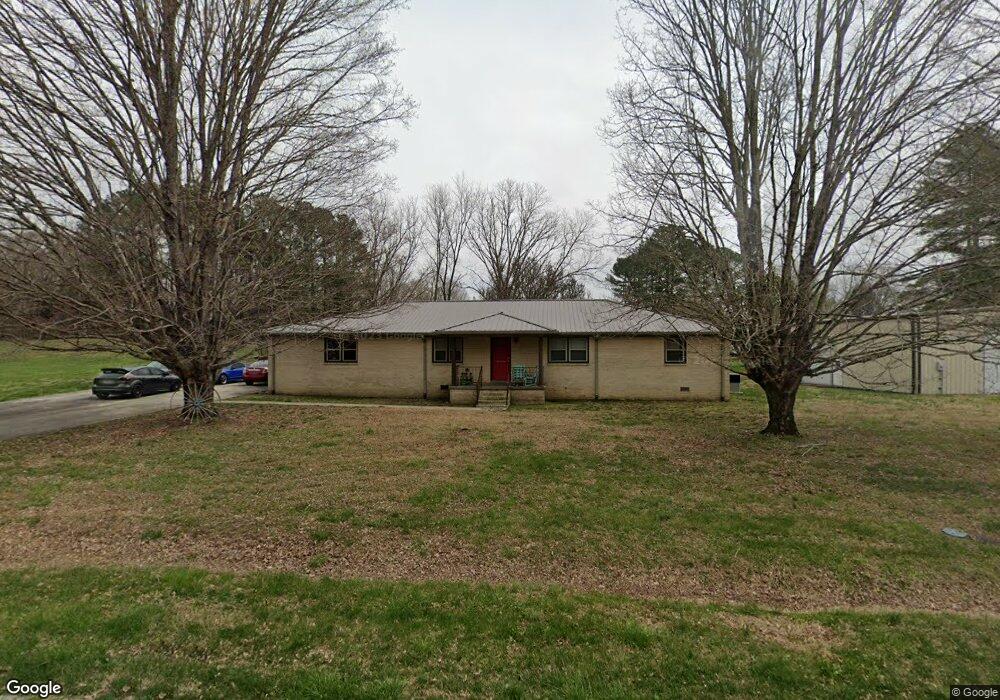
708 Redbud Cir Manchester, TN 37355
Estimated Value: $249,772 - $393,000
--
Bed
2
Baths
4,000
Sq Ft
$83/Sq Ft
Est. Value
About This Home
This home is located at 708 Redbud Cir, Manchester, TN 37355 and is currently estimated at $330,193, approximately $82 per square foot. 708 Redbud Cir is a home located in Coffee County with nearby schools including New Union Elementary School, Coffee County Middle School, and Coffee County Central High School.
Ownership History
Date
Name
Owned For
Owner Type
Purchase Details
Closed on
Mar 8, 2023
Sold by
Rickett Judy L
Bought by
Rickert Nathan J
Current Estimated Value
Home Financials for this Owner
Home Financials are based on the most recent Mortgage that was taken out on this home.
Original Mortgage
$278,286
Outstanding Balance
$269,549
Interest Rate
6.13%
Mortgage Type
FHA
Estimated Equity
$60,644
Purchase Details
Closed on
Apr 25, 2002
Sold by
Slutter Charles H
Bought by
Rickett Nathan J and Rickett Judy L
Home Financials for this Owner
Home Financials are based on the most recent Mortgage that was taken out on this home.
Original Mortgage
$87,250
Interest Rate
6.89%
Purchase Details
Closed on
Jun 29, 1987
Bought by
Droke Walter W and Droke Shirley
Create a Home Valuation Report for This Property
The Home Valuation Report is an in-depth analysis detailing your home's value as well as a comparison with similar homes in the area
Home Values in the Area
Average Home Value in this Area
Purchase History
| Date | Buyer | Sale Price | Title Company |
|---|---|---|---|
| Rickert Nathan J | -- | Foundation Title & Escrow | |
| Rickett Nathan J | $88,000 | -- | |
| Droke Walter W | $66,500 | -- |
Source: Public Records
Mortgage History
| Date | Status | Borrower | Loan Amount |
|---|---|---|---|
| Open | Rickert Nathan J | $278,286 | |
| Previous Owner | Droke Walter W | $87,250 |
Source: Public Records
Tax History Compared to Growth
Tax History
| Year | Tax Paid | Tax Assessment Tax Assessment Total Assessment is a certain percentage of the fair market value that is determined by local assessors to be the total taxable value of land and additions on the property. | Land | Improvement |
|---|---|---|---|---|
| 2024 | $1,238 | $53,100 | $6,250 | $46,850 |
| 2023 | $1,238 | $53,100 | $0 | $0 |
| 2022 | $1,238 | $53,100 | $6,250 | $46,850 |
| 2021 | $1,288 | $43,925 | $5,000 | $38,925 |
| 2020 | $1,288 | $43,925 | $5,000 | $38,925 |
| 2019 | $1,288 | $43,925 | $5,000 | $38,925 |
| 2018 | $1,288 | $43,925 | $5,000 | $38,925 |
| 2017 | $1,294 | $39,650 | $5,000 | $34,650 |
| 2016 | $876 | $39,650 | $5,000 | $34,650 |
| 2015 | $803 | $24,600 | $2,500 | $22,100 |
| 2014 | $803 | $24,596 | $0 | $0 |
Source: Public Records
Map
Nearby Homes
- 0 Fredonia Rd Unit RTC3043164
- 0 Fredonia Rd Unit RTC2945295
- 1579 Woodbury Hwy
- 417 Whispering Winds Dr
- 362 Lakeview St
- 3249 Fredonia Rd
- 6 Fredonia Rd
- 2262 Woodbury Hwy
- 0 Seminole Ln
- 603 Gilley Cir
- 287 Fredonia Rd
- 163 Stonehenge Ln
- 92 Lakeview St
- 62 Lakeview St
- 23 Country Cir
- 461 Hendrixson Dr
- 37 Laurel View St
- 57 Laurel View St
- 47 Laurel View St
- 27 Laurel View St
- 715 Redbud Cir
- 658 Redbud Cir
- 77 Dogwood Cir
- 624 Redbud Cir
- 657 Redbud Cir
- 566 Redbud Cir
- 528 Redbud Cir
- 508 Redbud Cir
- 56 Dogwood Cir
- 130 Dogwood Cir
- 454 Redbud Cir
- 420 Redbud Cir
- 402 Redbud Cir
- 403 Redbud Cir
- 327 Redbud Cir
- 292 Redbud Cir
- 307 Redbud Cir
- 153 Spring Hill Ln
- 242 Spring Hill Ln
- 242 Spring Hill Ln