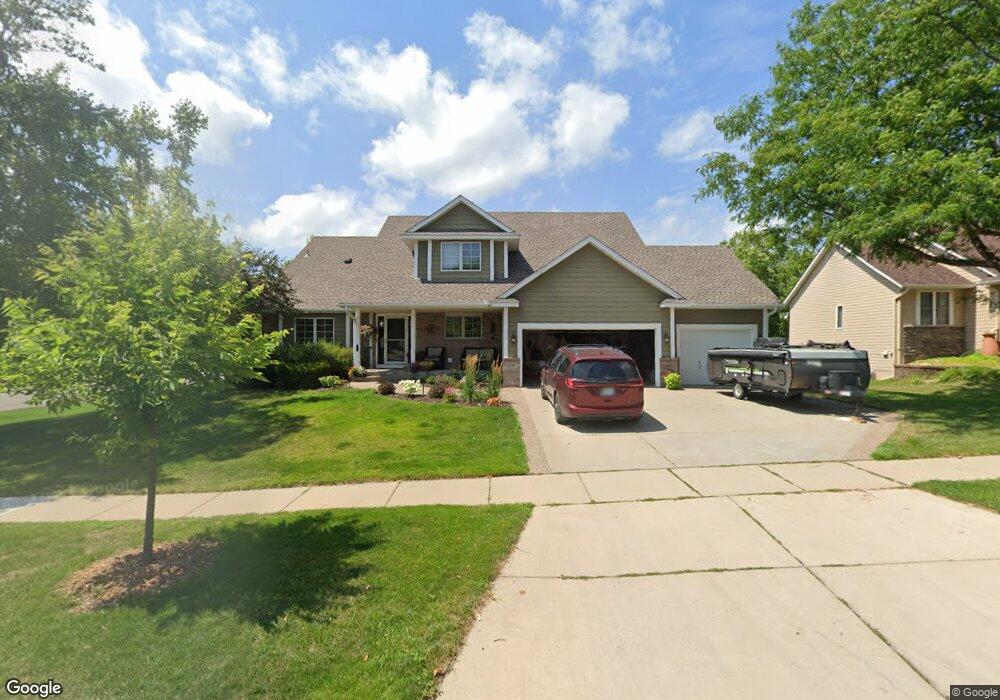
708 Turnberry Ln Northfield, MN 55057
Estimated Value: $653,000 - $668,069
5
Beds
4
Baths
2,343
Sq Ft
$283/Sq Ft
Est. Value
About This Home
This home is located at 708 Turnberry Ln, Northfield, MN 55057 and is currently estimated at $663,267, approximately $283 per square foot. 708 Turnberry Ln is a home located in Rice County with nearby schools including Spring Creek Elementary, Northfield Middle School, and Northfield Senior High School.
Ownership History
Date
Name
Owned For
Owner Type
Purchase Details
Closed on
Nov 9, 2017
Sold by
Geyen Randall and Landvik Geyen Lisa A
Bought by
Detert Matthew and Detert Tamara
Current Estimated Value
Home Financials for this Owner
Home Financials are based on the most recent Mortgage that was taken out on this home.
Original Mortgage
$296,100
Outstanding Balance
$248,118
Interest Rate
3.85%
Mortgage Type
New Conventional
Estimated Equity
$415,149
Purchase Details
Closed on
Sep 29, 2014
Sold by
Viesselman Karl Karl
Bought by
Geyen Randall Randall
Home Financials for this Owner
Home Financials are based on the most recent Mortgage that was taken out on this home.
Original Mortgage
$125,000
Interest Rate
4.2%
Purchase Details
Closed on
May 22, 2002
Sold by
Blilie Construction Company
Bought by
Peterson Margaret M
Create a Home Valuation Report for This Property
The Home Valuation Report is an in-depth analysis detailing your home's value as well as a comparison with similar homes in the area
Home Values in the Area
Average Home Value in this Area
Purchase History
| Date | Buyer | Sale Price | Title Company |
|---|---|---|---|
| Detert Matthew | $423,000 | Trademark Title Svcs Inc | |
| Geyen Randall Randall | $375,000 | -- | |
| Peterson Margaret M | $315,900 | -- |
Source: Public Records
Mortgage History
| Date | Status | Borrower | Loan Amount |
|---|---|---|---|
| Open | Detert Matthew | $296,100 | |
| Previous Owner | Geyen Randall Randall | $125,000 |
Source: Public Records
Tax History Compared to Growth
Tax History
| Year | Tax Paid | Tax Assessment Tax Assessment Total Assessment is a certain percentage of the fair market value that is determined by local assessors to be the total taxable value of land and additions on the property. | Land | Improvement |
|---|---|---|---|---|
| 2025 | $10,598 | $615,500 | $116,000 | $499,500 |
| 2024 | $10,598 | $545,500 | $108,300 | $437,200 |
| 2023 | $8,160 | $545,500 | $108,300 | $437,200 |
| 2022 | $7,434 | $504,600 | $103,100 | $401,500 |
| 2021 | $7,062 | $445,800 | $92,800 | $353,000 |
| 2020 | $7,230 | $417,000 | $85,900 | $331,100 |
| 2019 | $6,880 | $417,700 | $85,900 | $331,800 |
| 2018 | $6,830 | $393,400 | $85,900 | $307,500 |
| 2017 | $6,068 | $383,400 | $83,200 | $300,200 |
| 2016 | $6,010 | $370,400 | $74,900 | $295,500 |
| 2015 | $5,734 | $350,000 | $74,900 | $275,100 |
| 2014 | -- | $337,000 | $74,900 | $262,100 |
Source: Public Records
Map
Nearby Homes
- 805 Heywood Rd
- 1405 Mayflower Dr
- 840 Fremont St E
- 506 506 E 6th St
- 1809 Michigan Dr
- 405 8th St E
- 408 5th St E
- 1907 Erie Dr
- 1015 College St
- TBB 403 (To Be Built College St
- 1806 Prairie St
- 2019 Erie Dr
- 2015 Erie Dr
- 712 Maple Place
- 708 Maple Place
- 1907 Red Maple Ln
- 411 Washington St
- 9365 100th St E
- 917 Division St S
- 820 Superior Dr
- 708 708 Turnberry Ln
- 704 Turnberry Ln
- 704 704 Turnberry-Lane-
- 1610 Goldenrod Ct
- 800 Turnberry Ln
- 1700 Goldenrod Cir
- 700 Turnberry Ln
- 1611 Goldenrod Ct
- 1609 Mayflower Dr
- 1606 Goldenrod Ct
- 705 Turnberry Ln
- 804 Turnberry Ln
- 1720 Goldenrod Cir
- 1607 Goldenrod Ct
- 1605 Mayflower Dr
- 1704 Goldenrod Cir
- 1605 1605 Mayflower Dr
- 701 Turnberry Ln
- 1602 Goldenrod Ct
- 1603 Goldenrod Ct