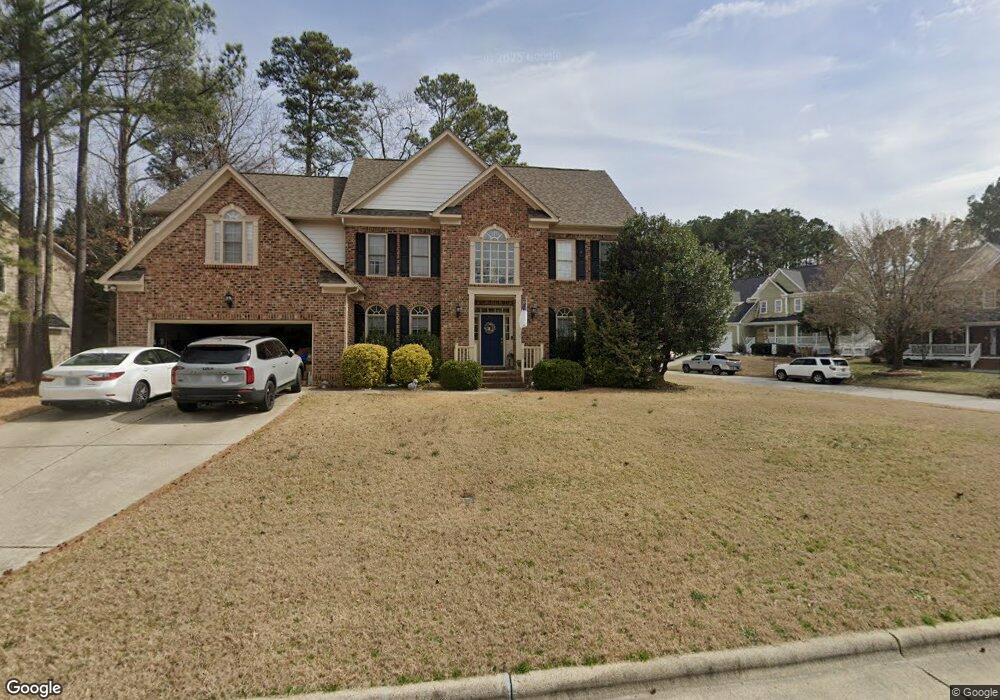
709 Brittley Way Apex, NC 27502
Beaver Creek NeighborhoodEstimated Value: $737,000 - $814,029
5
Beds
4
Baths
3,146
Sq Ft
$247/Sq Ft
Est. Value
About This Home
This home is located at 709 Brittley Way, Apex, NC 27502 and is currently estimated at $778,507, approximately $247 per square foot. 709 Brittley Way is a home located in Wake County with nearby schools including Salem Elementary, Salem Middle, and Apex High School.
Ownership History
Date
Name
Owned For
Owner Type
Purchase Details
Closed on
Aug 10, 2010
Sold by
Tharwani Haresh and Tharwani Veena
Bought by
Shibley Robert L and Shibley Araz L
Current Estimated Value
Home Financials for this Owner
Home Financials are based on the most recent Mortgage that was taken out on this home.
Original Mortgage
$310,000
Outstanding Balance
$206,592
Interest Rate
4.7%
Mortgage Type
New Conventional
Estimated Equity
$571,915
Purchase Details
Closed on
Aug 27, 2001
Sold by
Parker Lancaster & Orleans Inc
Bought by
Tharwani Haresh and Tharwani Veena
Home Financials for this Owner
Home Financials are based on the most recent Mortgage that was taken out on this home.
Original Mortgage
$299,560
Interest Rate
6.5%
Create a Home Valuation Report for This Property
The Home Valuation Report is an in-depth analysis detailing your home's value as well as a comparison with similar homes in the area
Home Values in the Area
Average Home Value in this Area
Purchase History
| Date | Buyer | Sale Price | Title Company |
|---|---|---|---|
| Shibley Robert L | $350,000 | None Available | |
| Tharwani Haresh | $300,000 | -- |
Source: Public Records
Mortgage History
| Date | Status | Borrower | Loan Amount |
|---|---|---|---|
| Open | Shibley Robert L | $310,000 | |
| Previous Owner | Tharwani Haresh | $299,560 |
Source: Public Records
Tax History Compared to Growth
Tax History
| Year | Tax Paid | Tax Assessment Tax Assessment Total Assessment is a certain percentage of the fair market value that is determined by local assessors to be the total taxable value of land and additions on the property. | Land | Improvement |
|---|---|---|---|---|
| 2025 | $6,667 | $761,318 | $190,000 | $571,318 |
| 2024 | $6,518 | $761,318 | $190,000 | $571,318 |
| 2023 | $5,158 | $468,359 | $92,000 | $376,359 |
| 2022 | $4,842 | $468,359 | $92,000 | $376,359 |
| 2021 | $4,657 | $468,359 | $92,000 | $376,359 |
| 2020 | $4,610 | $468,359 | $92,000 | $376,359 |
| 2019 | $4,586 | $402,080 | $92,000 | $310,080 |
| 2018 | $4,320 | $402,080 | $92,000 | $310,080 |
| 2017 | $4,021 | $402,080 | $92,000 | $310,080 |
| 2016 | $3,962 | $402,080 | $92,000 | $310,080 |
| 2015 | $4,004 | $396,651 | $84,000 | $312,651 |
| 2014 | $3,860 | $396,651 | $84,000 | $312,651 |
Source: Public Records
Map
Nearby Homes
- 303 Knightsborough Way
- 907 Haddon Hall Dr
- 1209 Haywards Heath Ln
- 102 Darley Dale Loop
- 506 W Chatham St
- 232 Eyam Hall Ln
- 235 Eyam Hall Ln
- 427 Eyam Hall Ln
- 1111 Platform Dr
- 919 Branch Line Ln
- 1115 Platform Dr
- 202 W Chatham St
- 953 Ambergate Station
- 105 Troyer Place
- 547 Grand Central Station
- 596 Grand Central Station
- 1800 Pierre Place
- 996 Tender Dr
- 903 Norwood Ln
- 309 Culvert St
- 711 Britley Way
- 711 Brittley Way
- 1003 Overcliff Dr
- 708 Brittley Way
- 713 Brittley Way
- 710 Brittley Way
- 706 Brittley Way
- 1005 Overcliff Dr
- 1000 Overcliff Dr
- 1002 Overcliff Dr
- 1004 Overcliff Dr
- 704 Brittley Way
- 715 Brittley Way
- 703 Haddon Hall Dr
- 101 Overcliff Dr
- 1006 Overcliff Dr
- 1007 Overcliff Dr
- 600 Knightsborough Way
- 602 Knightsborough Way
- 604 Knightsborough Way