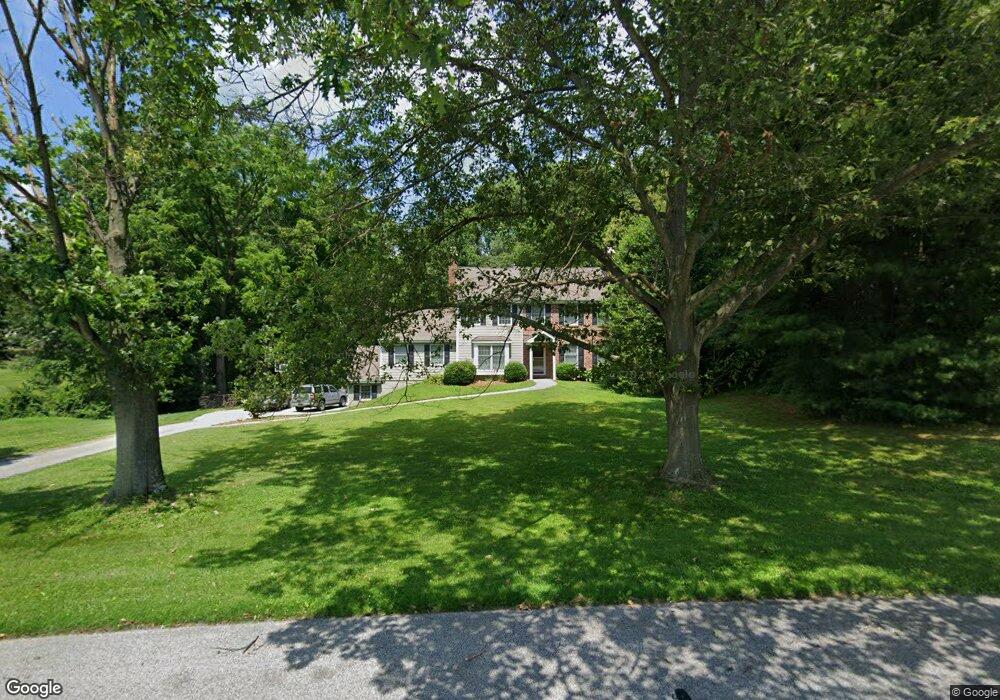
709 Denbigh Chase Kennett Square, PA 19348
East Marlborough Township NeighborhoodEstimated Value: $800,656 - $935,000
4
Beds
3
Baths
2,684
Sq Ft
$320/Sq Ft
Est. Value
About This Home
This home is located at 709 Denbigh Chase, Kennett Square, PA 19348 and is currently estimated at $857,664, approximately $319 per square foot. 709 Denbigh Chase is a home located in Chester County with nearby schools including Unionville Elementary School, Charles F. Patton Middle School, and Unionville High School.
Ownership History
Date
Name
Owned For
Owner Type
Purchase Details
Closed on
Aug 20, 2007
Sold by
Margolles Lucas Z and Lee Jung Rin
Bought by
Acland Daniel G and Acland Kathrine R
Current Estimated Value
Purchase Details
Closed on
Jul 7, 2004
Sold by
Summerville Kevin R and Summerville Shelley D
Bought by
Margolies Lucas Z and Lee Jung Rin
Home Financials for this Owner
Home Financials are based on the most recent Mortgage that was taken out on this home.
Original Mortgage
$360,000
Interest Rate
7.5%
Mortgage Type
Purchase Money Mortgage
Create a Home Valuation Report for This Property
The Home Valuation Report is an in-depth analysis detailing your home's value as well as a comparison with similar homes in the area
Home Values in the Area
Average Home Value in this Area
Purchase History
| Date | Buyer | Sale Price | Title Company |
|---|---|---|---|
| Acland Daniel G | $490,000 | None Available | |
| Margolies Lucas Z | $450,000 | -- |
Source: Public Records
Mortgage History
| Date | Status | Borrower | Loan Amount |
|---|---|---|---|
| Previous Owner | Margolies Lucas Z | $360,000 |
Source: Public Records
Tax History Compared to Growth
Tax History
| Year | Tax Paid | Tax Assessment Tax Assessment Total Assessment is a certain percentage of the fair market value that is determined by local assessors to be the total taxable value of land and additions on the property. | Land | Improvement |
|---|---|---|---|---|
| 2025 | $1,803 | $267,690 | $98,100 | $169,590 |
| 2024 | $1,803 | $267,690 | $98,100 | $169,590 |
| 2023 | $1,803 | $267,690 | $98,100 | $169,590 |
| 2022 | $1,499 | $267,690 | $98,100 | $169,590 |
| 2021 | $1,803 | $267,690 | $98,100 | $169,590 |
| 2020 | $1,451 | $267,690 | $98,100 | $169,590 |
| 2019 | $1,754 | $267,690 | $98,100 | $169,590 |
| 2018 | $1,754 | $267,690 | $98,100 | $169,590 |
| 2017 | $1,752 | $267,390 | $98,100 | $169,290 |
| 2016 | $1,049 | $267,390 | $98,100 | $169,290 |
| 2015 | $1,049 | $267,390 | $98,100 | $169,290 |
| 2014 | $1,049 | $267,390 | $98,100 | $169,290 |
Source: Public Records
Map
Nearby Homes
- 505 Wisteria Dr
- 347 Astilbe Dr
- 113 Lantana Dr
- 454 Larkspur Dr
- 213 Katsura Dr
- 102 Manor Dr
- 765 Folly Hill Rd
- 2039-2035 Lenape Unionville Rd
- 217 Kirkbrae Rd
- 312 Riverbirch Cir Unit 802
- 323 E Street Rd
- 1776 W Doe Run Rd
- 327 E Street Rd
- 907 Unionville Wawaset Rd
- 1053 Unionville Wawaset Rd
- 101 Bailey Cir
- 804 Waverly Rd
- 617 Unionville Rd
- 191 W Street Rd
- 0 Haines Mill Rd
- 711 Denbigh Chase
- 707 Denbigh Chase
- 704 Denbigh Chase
- 713 Pheasant Run
- 711 Pheasant Run
- 713 Denbigh Chase
- 6 Clover Ln
- 709 Pheasant Run
- 702 Denbigh Chase
- 2 Clover Ln
- 708 Denbigh Chase
- 706 Denbigh Chase
- 705 Denbigh Chase
- 10 Clover Ln
- 710 Denbigh Chase
- 700 Denbigh Chase
- 705 Pheasant Run
- 2 Greenbriar Ln
- 712 Denbigh Chase
- 3 Clover Ln