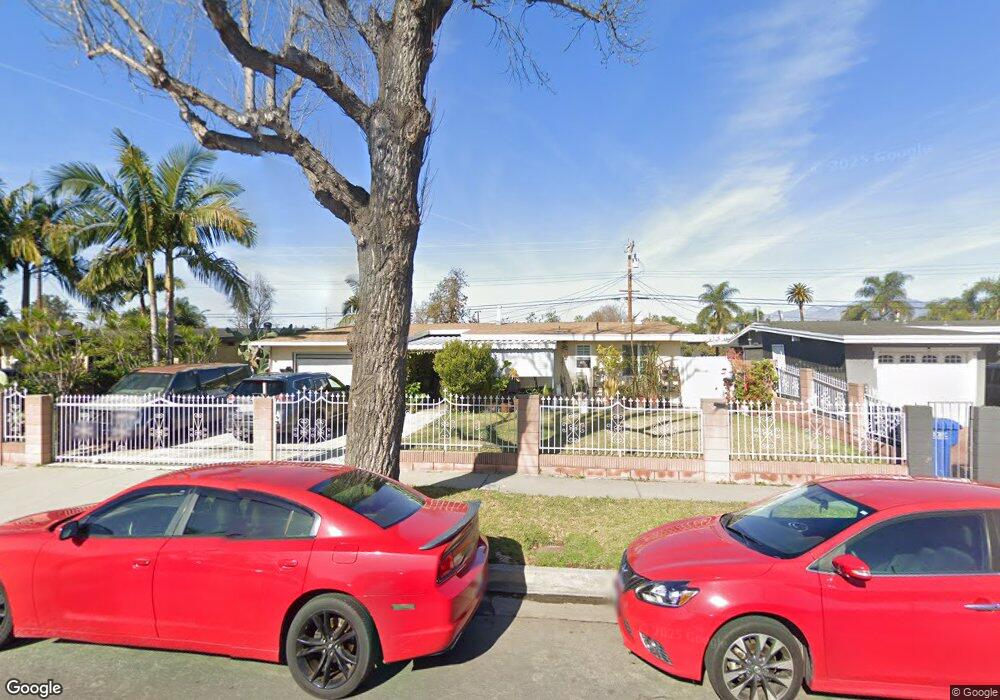
709 Millbury Ave La Puente, CA 91746
West Puente Valley NeighborhoodEstimated Value: $662,000 - $730,000
4
Beds
2
Baths
1,111
Sq Ft
$627/Sq Ft
Est. Value
About This Home
This home is located at 709 Millbury Ave, La Puente, CA 91746 and is currently estimated at $696,323, approximately $626 per square foot. 709 Millbury Ave is a home located in Los Angeles County with nearby schools including J.E. Van Wig Elementary School, Torch Middle School, and Bassett Senior High School.
Ownership History
Date
Name
Owned For
Owner Type
Purchase Details
Closed on
May 14, 2003
Sold by
Villagrana Avelino and Villagrana Abelino
Bought by
Villagrana Avelino
Current Estimated Value
Home Financials for this Owner
Home Financials are based on the most recent Mortgage that was taken out on this home.
Original Mortgage
$135,000
Interest Rate
5.71%
Purchase Details
Closed on
Nov 22, 1995
Sold by
Villagrana Antolina
Bought by
Villagrana Abelino
Home Financials for this Owner
Home Financials are based on the most recent Mortgage that was taken out on this home.
Original Mortgage
$104,250
Interest Rate
7.42%
Purchase Details
Closed on
Mar 28, 1994
Sold by
Villagrana Antolina and Villagrana Abelino
Bought by
Villagrana Abelino
Home Financials for this Owner
Home Financials are based on the most recent Mortgage that was taken out on this home.
Original Mortgage
$95,550
Interest Rate
10.5%
Create a Home Valuation Report for This Property
The Home Valuation Report is an in-depth analysis detailing your home's value as well as a comparison with similar homes in the area
Home Values in the Area
Average Home Value in this Area
Purchase History
| Date | Buyer | Sale Price | Title Company |
|---|---|---|---|
| Villagrana Avelino | -- | Diversified Title & Escrow S | |
| Villagrana Abelino | -- | Title Land Company | |
| Villagrana Abelino | -- | Commonwealth Land Title Ins |
Source: Public Records
Mortgage History
| Date | Status | Borrower | Loan Amount |
|---|---|---|---|
| Closed | Villagrana Avelino | $135,000 | |
| Closed | Villagrana Abelino | $104,250 | |
| Closed | Villagrana Abelino | $95,550 |
Source: Public Records
Tax History
| Year | Tax Paid | Tax Assessment Tax Assessment Total Assessment is a certain percentage of the fair market value that is determined by local assessors to be the total taxable value of land and additions on the property. | Land | Improvement |
|---|---|---|---|---|
| 2025 | $3,188 | $217,186 | $108,767 | $108,419 |
| 2024 | $3,188 | $212,929 | $106,635 | $106,294 |
| 2023 | $3,096 | $208,755 | $104,545 | $104,210 |
| 2022 | $2,970 | $204,663 | $102,496 | $102,167 |
| 2021 | $2,915 | $200,651 | $100,487 | $100,164 |
| 2019 | $2,846 | $194,701 | $97,507 | $97,194 |
| 2018 | $2,717 | $190,885 | $95,596 | $95,289 |
| 2016 | $2,609 | $183,475 | $91,885 | $91,590 |
| 2015 | $2,547 | $180,720 | $90,505 | $90,215 |
| 2014 | $2,436 | $177,181 | $88,733 | $88,448 |
Source: Public Records
Map
Nearby Homes
- 13622 Hartsville St
- 915 Stichman Ave
- 1003 Le Borgne Ave
- 1021 Big Dalton Ave
- 416 Mayland Ave
- 319 Le Borgne Ave
- 452 Willow Ave
- 1148 Stichman Ave
- 335 Willow Ave
- 13215 Judith St
- 1236 Stichman Ave
- 536 Sandsprings Dr
- 13540 Valley Blvd
- 731 N Orange Ave
- 1106 Sunkist Ave
- 544 N Orange Ave Unit B
- 14309 Beckner St
- 13013 Judith St
- 14333 Beckner St
- 12828 Hensel St
- 715 Millbury Ave
- 703 Millbury Ave
- 714 Big Dalton Ave
- 720 Big Dalton Ave
- 721 Millbury Ave
- 681 Millbury Ave
- 708 Big Dalton Ave
- 726 Big Dalton Ave
- 708 Millbury Ave
- 714 Millbury Ave
- 702 Big Dalton Ave
- 702 Millbury Ave
- 675 Millbury Ave
- 727 Millbury Ave
- 732 Big Dalton Ave
- 720 Millbury Ave
- 680 Millbury Ave
- 674 Big Dalton Ave
- 669 Millbury Ave
- 733 Millbury Ave
Your Personal Tour Guide
Ask me questions while you tour the home.