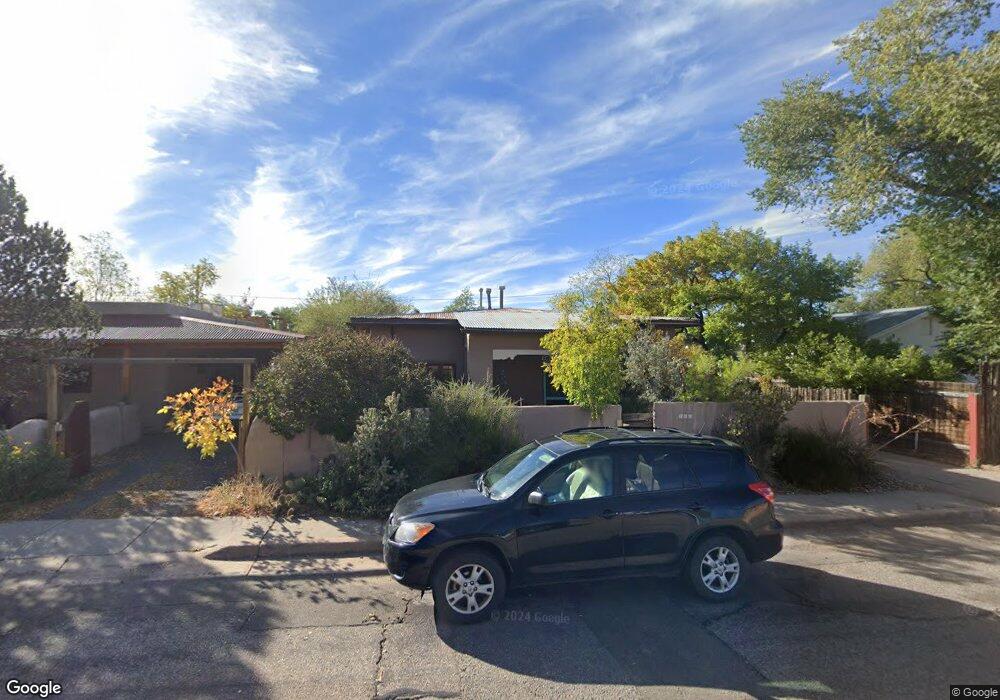
709 Onate Place Santa Fe, NM 87505
Estimated Value: $505,000 - $676,000
2
Beds
2
Baths
1,555
Sq Ft
$375/Sq Ft
Est. Value
About This Home
This home is located at 709 Onate Place, Santa Fe, NM 87505 and is currently estimated at $583,427, approximately $375 per square foot. 709 Onate Place is a home located in Santa Fe County with nearby schools including Aspen Community Magnet School, Capital High School, and Dragonfly School.
Ownership History
Date
Name
Owned For
Owner Type
Purchase Details
Closed on
Jan 14, 2013
Sold by
Marsh Roger and Marsh Melissa Edmands
Bought by
North Point Trust Co Llc and The Amy E Westphal Trust
Current Estimated Value
Purchase Details
Closed on
Mar 30, 2005
Sold by
Razatos Andrew P and Razatos Jessica A
Bought by
Marsh Roger and Marsh Melissa Edmands
Home Financials for this Owner
Home Financials are based on the most recent Mortgage that was taken out on this home.
Original Mortgage
$238,400
Interest Rate
5.71%
Mortgage Type
Purchase Money Mortgage
Purchase Details
Closed on
Jul 2, 2002
Sold by
Montoya Roger and Montoya Veronica Consuelo
Bought by
Razatos Andrew P and Razatos Jessica A
Home Financials for this Owner
Home Financials are based on the most recent Mortgage that was taken out on this home.
Original Mortgage
$160,312
Interest Rate
6.78%
Purchase Details
Closed on
Sep 10, 1996
Sold by
Montoya Quintana Criselda R
Bought by
Montoya Veronica Consuelo
Create a Home Valuation Report for This Property
The Home Valuation Report is an in-depth analysis detailing your home's value as well as a comparison with similar homes in the area
Home Values in the Area
Average Home Value in this Area
Purchase History
| Date | Buyer | Sale Price | Title Company |
|---|---|---|---|
| North Point Trust Co Llc | -- | Fidelity National Title Of N | |
| Marsh Roger | -- | Ccts | |
| Razatos Andrew P | -- | First American Title Ins Co | |
| Montoya Veronica Consuelo | -- | -- |
Source: Public Records
Mortgage History
| Date | Status | Borrower | Loan Amount |
|---|---|---|---|
| Previous Owner | Marsh Roger | $238,400 | |
| Previous Owner | Razatos Andrew P | $160,312 |
Source: Public Records
Tax History Compared to Growth
Tax History
| Year | Tax Paid | Tax Assessment Tax Assessment Total Assessment is a certain percentage of the fair market value that is determined by local assessors to be the total taxable value of land and additions on the property. | Land | Improvement |
|---|---|---|---|---|
| 2024 | $2,218 | $291,100 | $83,581 | $207,519 |
| 2023 | $2,218 | $282,622 | $81,147 | $201,475 |
| 2022 | $2,169 | $274,391 | $78,784 | $195,607 |
| 2021 | $2,136 | $88,800 | $25,496 | $63,304 |
| 2020 | $2,072 | $86,214 | $24,754 | $61,460 |
| 2019 | $2,043 | $83,703 | $24,033 | $59,670 |
| 2018 | $1,998 | $81,265 | $23,333 | $57,932 |
| 2017 | $1,948 | $78,899 | $23,333 | $55,566 |
| 2016 | $1,836 | $76,600 | $23,333 | $53,267 |
| 2015 | $1,868 | $77,466 | $23,333 | $54,133 |
| 2014 | $1,773 | $75,824 | $23,310 | $52,514 |
Source: Public Records
Map
Nearby Homes
- 537 Kathryn Ave
- 543 Juanita St Unit B
- 630 Alicia St
- 1701 Paseo de Peralta
- 506 Onate Place
- 842 W Manhattan Ave
- 845 Gilmore St
- 903 Agua Fria St
- 1428 1/2 Hickox St
- 631 Calle Grillo
- 456 Amado St
- 622 Calle Grillo
- 1012 Marquez Place Unit 104B
- 1217 Agua Fria St
- 824 Dunlap St Unit A
- 728 Agua Fria St Unit F
- 1022 Don Diego Ave Unit D
- 1530 Hickox St
- 1536 1/2 Hickox St
- 132 Romero St Unit 12
- 709 Onate St
- 711 Onate St
- 707 Onate St
- 713 Onate St
- 713 Onate Place
- 708 Franklin Ave
- 712 Franklin Ave
- 706 Franklin Ave
- 715 Onate Place Unit 3
- 715 Onate Place
- 714 Franklin Ave
- 704 Franklin Ave
- 710 Onate St
- 710 Onate St Unit A,B,C
- 706 Onate St
- 715 Onate St
- 712 Onate St
- 712 Onate St
- 701 Onate St
- 712 Onate Place