Absolutely great investment property with income of 850 monthly. Long term tenant since 2013 with no desire to leave. This 3 bedroom home has plenty of space in and out with yard being huge in back. Close to all amenities. Whether starting or continuing your investment portfolio don't skip this one!
Coldwell Banker Heritage RealtorsLicense #000329385Listed on: 06/13/2025
Home Details
Home Type
Single Family
Est. Annual Taxes
$900
Year Built
Built in 1920
Lot Details
8,276 Sq Ft Lot
Lot Dimensions are 42 x 192
Parking
No Garage
Home Design
Bungalow
Wood Siding
Interior Spaces
1,118 Sq Ft Home
1-Story Property
Partial Basement
Bedrooms and Bathrooms
3 Bedrooms
1 Full Bathroom
Outdoor Features
Porch
Utilities
Window Unit Cooling System
Forced Air Heating System
Heating System Uses Natural Gas
Natural Gas Connected
Community Details
No Home Owners Association
Listing and Financial Details
Assessor Parcel Number N44010960
Home Details
Home Type
Single Family
Est. Annual Taxes
$900
Year Built
Built in 1920
Lot Details
0
Listing Details
Property Type: Residential
Architectural Style: Bungalow
Structure Type: House
Level Style: One
Semi-Annual Tax: 450.00
Year Built: 1920
Document Count: 2
Documents: Property Disclosure and Lead Based Paint
Listing I D: 1039396
M L S Approved: Y
M L S Identifier: 20190724221641160008000000
New Financing: Cash, Conventional
Parcel I D Number Formatted: N44010960
Property Group I D: 19990816212109142258000000
Subtype: Single Family Residence
Type Of Contract: Exclusive Right To Sell
Condo Lot Y N: No
H O A C O A Y N: No
Special Features: None
Property Sub Type: Detached
Stories: 1
Interior Features
Total Bathrooms: 1.00
Full Bathrooms: 1
Basement: Partial
Price/ Sq Ft: 50.09
Total Bedrooms: 3
Total Square Footage: 1118.00
Exterior Features
Exterior: Wood Siding
Outside Features: Porch
Garage/Parking
Garage: No Garage
Utilities
Cooling: Window Unit(s)
Heating System: Forced Air, Natural Gas
Utilities: Natural Gas Connected, Sewer Connected
Sewer: Public Sewer
Water Source: Supplied Water
Schools
School District: 5507 Piqua CSD
Lot Info
Acres: 0.19
Lot Dimensions: 42 x 192
Zoning: Residential
Land Info: Residential Lot
Parcel Id Number: N44010960
Tax Info
Tax Year: 2024
MLS Schools
School District: 5507 Piqua CSD
Map
Range of Values:
Collateral Analytics
Collateral Analytics
Collateral Analytics AVMs (Automated Valuation Model) employ a number of statistical approaches combined with neighborhood-specific comparable selection guarantees the most up-to-date and precise valuations.
Not Available
Collateral Analytics does not have data for the current month. Please view the chart for historical values.
ICE
ICE Mortgage Technology
ICE Mortgage Technology’s AVM (Automated Valuation Model) is a state-of-the-art online residential property valuation tool that provides a quick and accurate estimate of the value of almost any home in the U.S.
Not Available
ICE Mortgage Technology does not have data for the current month. Please view the chart for historical values.
First American
First American
First American Data & Analytics’ next-generation AVM combines unrivaled data assets with a blended ensemble of valuation models to produce highly accurate, reliable valuations you can trust.
Not Available
First American does not have data for the current month. Please view the chart for historical values.
Quantarium
Quantarium
Quantarium’s valuation service, repeatedly proven the industry’s most accurate and comprehensive, is supercharged with a self-learning and auto-tuning AI engine that continually becomes smarter and more accurate as it processes daily inputs from the industry’s leading RE data lake.
Not Available
Quantarium does not have data for the current month. Please view the chart for historical values.
Average Value
Not Available
List Price
Sold Price
Create a Home Valuation Report for This Property
The Home Valuation Report is an in-depth analysis detailing your home's value as well as a comparison with similar homes in the area
Home Values in the Area
Source: Public Records
Average Home Value in this Area
Source: Public Records
Tax History
Year
Tax Paid
Tax AssessmentTax Assessment
Total Assessment is a certain percentage of the fair market value that is determined by local assessors to be the total taxable value of land and additions on the property.
Land
Improvement
2024
$687
$16,240
$6,160
$10,080
2023
$687
$16,240
$6,160
$10,080
2022
$699
$16,240
$6,160
$10,080
2021
$564
$12,010
$4,550
$7,460
2020
$554
$12,010
$4,550
$7,460
2019
$557
$12,010
$4,550
$7,460
2018
$464
$9,520
$4,550
$4,970
2017
$470
$9,520
$4,550
$4,970
2016
$465
$9,520
$4,550
$4,970
2015
$475
$9,520
$4,550
$4,970
2014
$475
$9,520
$4,550
$4,970
2013
$477
$9,520
$4,550
$4,970
Source: Public Records
Property History
Date
Event
Price
Change
Sq Ft Price
06/17/202506/17/25
Pending
--
--
--
06/13/202506/13/25
For Sale
$56,000
--
$50 / Sq Ft
Source: Western Regional Information Systems & Technology (WRIST)
Nice sized home with plenty of space. Close to shopping and all you needs. Currently rented at 750 per month so great investment opportunity or someone needing space. Updated furnace
Buy 1 or also the house next door and priced similar to double but single family homes. Long term tenant who wants to remain. Newer vinyl siding so very much turn-key. Very low traffic area
Excellent rental income and can also buy 514 Garnsey as a package own the benefit of 2 properties at cost of most doubles. This 1 bedroom little cutie has been occupied with long term tenant at rate of $500 monthly.
Almost country with this 3 bedroom home. Sits at edge of town and is currently rented at 950 monthly. Tenant pays all utilities and would like to stay. Newer furnace and electrical box.
Fantastic investment opportunity in the heart of Piqua! Can be used as a business/residence, a single family home or as a rental investment. 3 beds, 2.5 baths with a wrap around porch. HUGE kitchen addition. With a little TLC, this will become a dream property, no matter how you choose to use it!
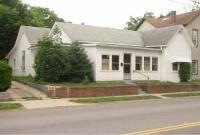
This home is located at 709 S Main St, Piqua, OH 45356 and is currently priced at $56,000, approximately $50 per square foot. This property was built in 1920. 709 S Main St is a home located in Miami County with nearby schools including Piqua Junior High School, Piqua High School, and Nicholas School.
Disclaimer: Certain information contained herein is derived from information provided by parties other than Homes.com. All information provided is deemed reliable, but is not guaranteed to be accurate and should be independently verified.
IDX information is provided exclusively for personal, non-commercial use, and may not be used for any purpose other than to identify prospective properties consumers may be interested in purchasing.