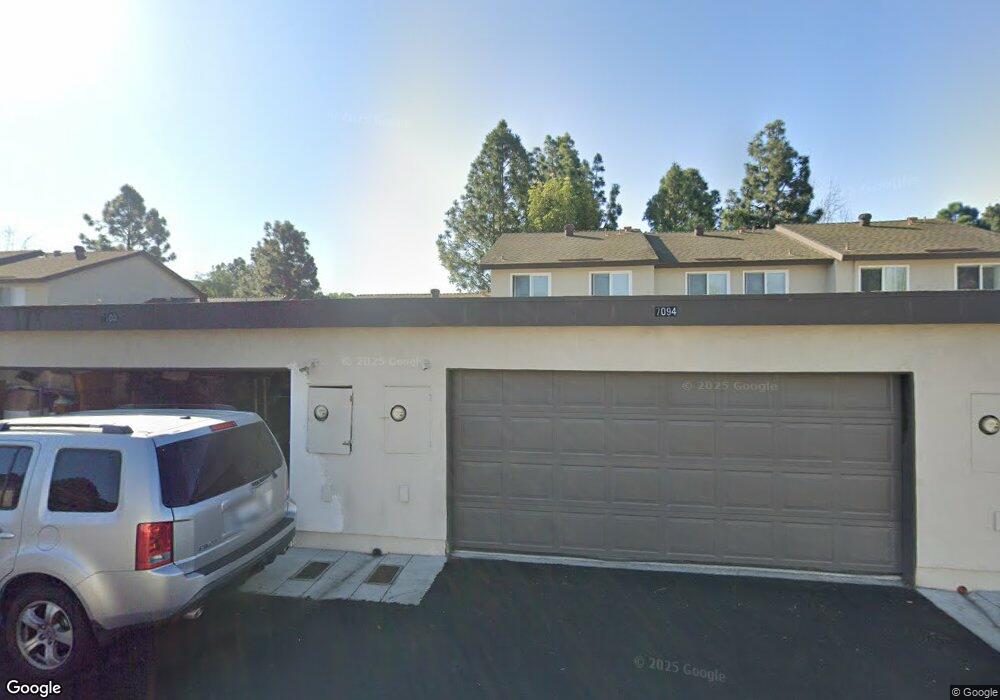
7094 Fulton Way Stanton, CA 90680
Estimated Value: $620,000 - $702,031
3
Beds
2
Baths
1,159
Sq Ft
$568/Sq Ft
Est. Value
About This Home
This home is located at 7094 Fulton Way, Stanton, CA 90680 and is currently estimated at $658,508, approximately $568 per square foot. 7094 Fulton Way is a home located in Orange County with nearby schools including Bryant Elementary School, Hilton D. Bell Intermediate School, and Pacifica High School.
Ownership History
Date
Name
Owned For
Owner Type
Purchase Details
Closed on
Jul 27, 2021
Sold by
Duong Quan
Bought by
Duong Quan and Vo Hue Bach
Current Estimated Value
Purchase Details
Closed on
Jun 2, 2005
Sold by
Vo Hue Bach
Bought by
Duong Quan
Home Financials for this Owner
Home Financials are based on the most recent Mortgage that was taken out on this home.
Original Mortgage
$292,000
Outstanding Balance
$151,075
Interest Rate
5.72%
Mortgage Type
Fannie Mae Freddie Mac
Estimated Equity
$507,433
Purchase Details
Closed on
May 23, 2005
Sold by
Connors Charles E and Connors Barbara A
Bought by
Duong Quan
Home Financials for this Owner
Home Financials are based on the most recent Mortgage that was taken out on this home.
Original Mortgage
$292,000
Outstanding Balance
$151,075
Interest Rate
5.72%
Mortgage Type
Fannie Mae Freddie Mac
Estimated Equity
$507,433
Purchase Details
Closed on
Nov 11, 1998
Sold by
Connors Charles E and Connors Barbara
Bought by
Connors Charles E and Connors Barbara A
Create a Home Valuation Report for This Property
The Home Valuation Report is an in-depth analysis detailing your home's value as well as a comparison with similar homes in the area
Home Values in the Area
Average Home Value in this Area
Purchase History
We collect this data history from publicly available records. To have your information removed, we recommend requesting removal directly through your county’s website.
| Date | Buyer | Sale Price | Title Company |
|---|---|---|---|
| Duong Quan | -- | None Available | |
| Duong Quan | -- | First American Title Co | |
| Duong Quan | $365,000 | First American Title Co | |
| Connors Charles E | -- | -- |
Source: Public Records
Mortgage History
We collect this data history from publicly available records. To have your information removed, we recommend requesting removal directly through your county’s website.
| Date | Status | Borrower | Loan Amount |
|---|---|---|---|
| Open | Duong Quan | $292,000 |
Source: Public Records
Tax History
| Year | Tax Paid | Tax Assessment Tax Assessment Total Assessment is a certain percentage of the fair market value that is determined by local assessors to be the total taxable value of land and additions on the property. | Land | Improvement |
|---|---|---|---|---|
| 2025 | $5,844 | $508,768 | $404,560 | $104,208 |
| 2024 | $5,844 | $498,793 | $396,628 | $102,165 |
| 2023 | $5,429 | $460,897 | $379,968 | $80,929 |
| 2022 | $5,349 | $451,860 | $372,517 | $79,343 |
| 2021 | $5,299 | $443,000 | $365,212 | $77,788 |
| 2020 | $4,889 | $407,000 | $329,212 | $77,788 |
| 2019 | $4,854 | $407,000 | $329,212 | $77,788 |
| 2018 | $4,597 | $383,000 | $305,212 | $77,788 |
| 2017 | $4,361 | $360,000 | $282,212 | $77,788 |
| 2016 | $4,036 | $340,000 | $262,212 | $77,788 |
| 2015 | $3,825 | $320,000 | $242,212 | $77,788 |
| 2014 | $3,443 | $290,012 | $212,224 | $77,788 |
Source: Public Records
Map
Nearby Homes
- 7085 Fulton Way
- 11203 Lambert Way
- 12715 Trojan Way
- 12151 Trojan Way
- 7271 Katella Ave Unit 99
- 10760 Knott Ave
- 10732 Knott Ave
- 6909 Andrew Way
- 11271 Lowell Ct
- 7100 Cerritos Ave Unit 112
- 7100 Cerritos Ave Unit 21
- 10592 Pamela St
- 7251 Middlesex Dr
- 10661 Ritter St
- 10546 Knott Ave Unit 3
- 6638 Southampton Dr
- 11473 Miscou Way
- 6693 Teakwood St
- 11366 Holder St
- 18 Redwood Ct Unit 18
- 11071 Grant Way
- 11075 Grant Way
- 11067 Grant Way
- 11081 Grant Way
- 11061 Grant Way
- 11091 Grant Way
- 7078 Auburn Way
- 11078 Grant Way
- 11082 Grant Way
- 11086 Grant Way
- 11076 Grant Way
- 7070 Auburn Way
- 11074 Grant Way
- 11090 Grant Way
- 11068 Grant Way
- 7066 Auburn Way
- 7097 Fulton Way
- 7091 Fulton Way
- 11062 Grant Way
- 7101 Fulton Way
Your Personal Tour Guide
Ask me questions while you tour the home.