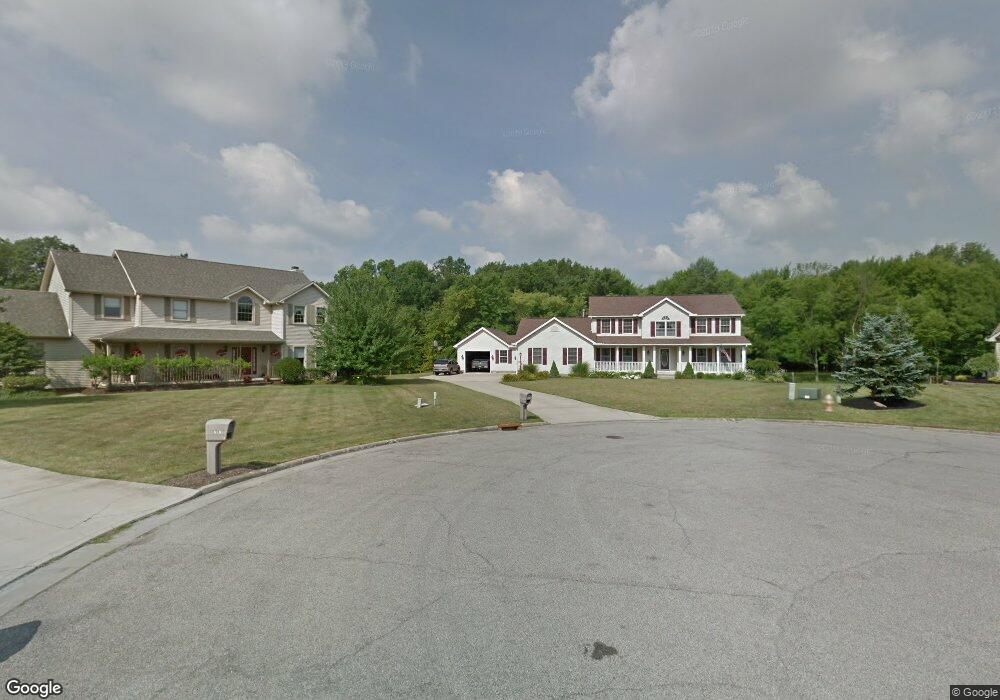
7099 Ruby Courts Youngstown, OH 44515
Austintown NeighborhoodEstimated Value: $399,000 - $496,000
4
Beds
3
Baths
2,532
Sq Ft
$174/Sq Ft
Est. Value
About This Home
This home is located at 7099 Ruby Courts, Youngstown, OH 44515 and is currently estimated at $441,577, approximately $174 per square foot. 7099 Ruby Courts is a home located in Mahoning County with nearby schools including Austintown Elementary School, Austintown Intermediate School, and Austintown Middle School.
Ownership History
Date
Name
Owned For
Owner Type
Purchase Details
Closed on
Dec 11, 2015
Sold by
Amy O Brien Timothy A and Brien Amy O
Bought by
Amy O Brien Timothy A and Brien Amy O
Current Estimated Value
Home Financials for this Owner
Home Financials are based on the most recent Mortgage that was taken out on this home.
Original Mortgage
$190,000
Outstanding Balance
$148,254
Interest Rate
3.88%
Mortgage Type
New Conventional
Estimated Equity
$293,323
Purchase Details
Closed on
Oct 29, 2001
Sold by
Valley Nicholas J & Valley Maria A
Bought by
Obrien Timothy A
Home Financials for this Owner
Home Financials are based on the most recent Mortgage that was taken out on this home.
Original Mortgage
$35,000
Interest Rate
6.68%
Mortgage Type
Balloon
Purchase Details
Closed on
Jun 7, 1999
Sold by
Mcconnell Vincent
Bought by
Valley Nicholas J and Valley Maria A
Purchase Details
Closed on
Apr 26, 1994
Bought by
Hutchinson Jack E and Hutchinson Mary
Create a Home Valuation Report for This Property
The Home Valuation Report is an in-depth analysis detailing your home's value as well as a comparison with similar homes in the area
Home Values in the Area
Average Home Value in this Area
Purchase History
| Date | Buyer | Sale Price | Title Company |
|---|---|---|---|
| Amy O Brien Timothy A | -- | Attorney | |
| Obrien Timothy A | $45,000 | -- | |
| Valley Nicholas J | $43,500 | -- | |
| Hutchinson Jack E | -- | -- |
Source: Public Records
Mortgage History
| Date | Status | Borrower | Loan Amount |
|---|---|---|---|
| Open | Amy O Brien Timothy A | $190,000 | |
| Closed | Obrien Timothy A | $35,000 |
Source: Public Records
Tax History
| Year | Tax Paid | Tax Assessment Tax Assessment Total Assessment is a certain percentage of the fair market value that is determined by local assessors to be the total taxable value of land and additions on the property. | Land | Improvement |
|---|---|---|---|---|
| 2025 | $6,036 | $125,860 | $15,610 | $110,250 |
| 2024 | $5,762 | $125,860 | $15,610 | $110,250 |
| 2023 | $5,671 | $125,860 | $15,610 | $110,250 |
| 2022 | $5,486 | $97,610 | $15,610 | $82,000 |
| 2021 | $5,489 | $97,610 | $15,610 | $82,000 |
| 2020 | $5,512 | $97,610 | $15,610 | $82,000 |
| 2019 | $5,757 | $92,960 | $14,860 | $78,100 |
| 2018 | $5,539 | $92,960 | $14,860 | $78,100 |
| 2017 | $5,327 | $92,960 | $14,860 | $78,100 |
| 2016 | $5,117 | $85,060 | $12,100 | $72,960 |
| 2015 | $4,961 | $85,060 | $12,100 | $72,960 |
| 2014 | $4,984 | $85,060 | $12,100 | $72,960 |
| 2013 | $4,930 | $85,060 | $12,100 | $72,960 |
Source: Public Records
Map
Nearby Homes
- 2998 Whispering Pines Dr
- 3013 Whispering Pines Dr
- 6581 Country Ridge Ave
- 3121 Meanderwood Dr
- 3449 Meanderwood Dr
- 583 Wyndclift Cir
- 9112 New Rd
- 6270 Fairview Rd
- 6266 Fairview Rd
- 379 Wyndclift Place
- 6948 Meander Reserve Ct
- 242 Wilcox Rd Unit 242
- 0 Maple Ave Unit 5190079
- 0 Maple Ave Unit 5190077
- 0 Maple Ave Unit 5190082
- 69 N Turner Rd
- 370 Wilcox Rd
- 519 Wilcox Rd Unit A
- 100 Clearwater Cove S
- 6042 Callaway Cir Unit 5
- 7091 Ruby Courts
- 7109 Ruby Courts
- 7081 Ruby Courts
- 7119 Ruby Courts
- 1880 Mary Place
- 7071 Ruby Courts
- 1870 Mary Place
- 7061 Ruby Courts
- 1891 Mary Place
- 1881 Mary Place
- 7051 Ruby Courts
- 1860 Mary Place
- 1871 Mary Place
- 6825 Ruby Courts
- 6835 Ruby Ct
- 1850 Mary Place
- 7041 Ruby Courts
- 7040 Ruby Courts
- 6845 Ruby Courts
- 7071 New Rd
Your Personal Tour Guide
Ask me questions while you tour the home.