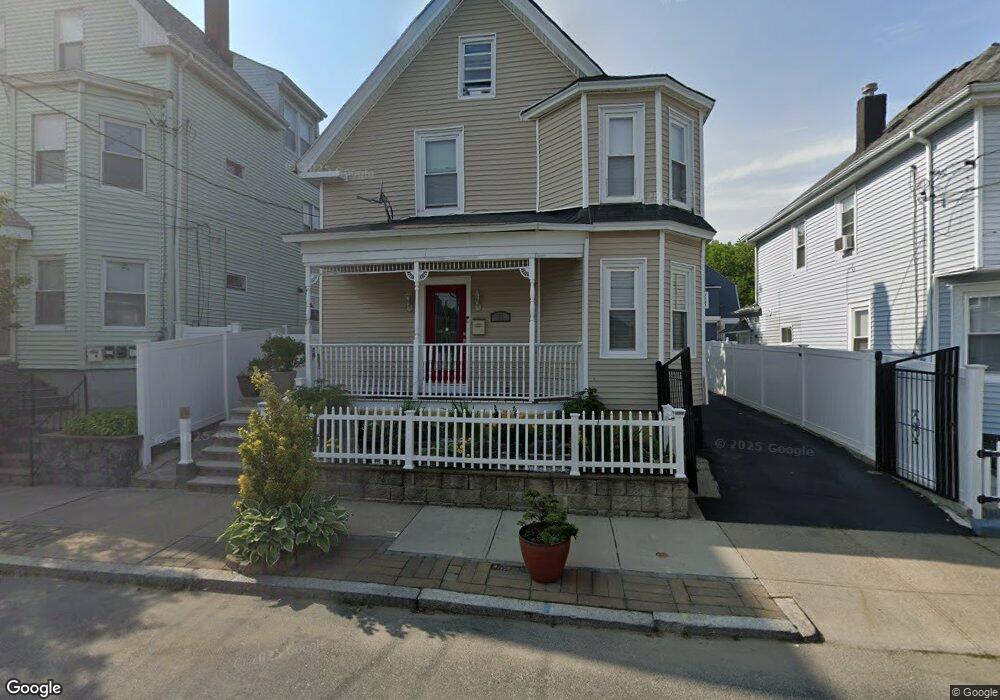
71 Calla St Providence, RI 02905
Washington Park NeighborhoodEstimated Value: $355,000 - $404,000
6
Beds
2
Baths
1,326
Sq Ft
$289/Sq Ft
Est. Value
About This Home
This home is located at 71 Calla St, Providence, RI 02905 and is currently estimated at $382,595, approximately $288 per square foot. 71 Calla St is a home located in Providence County with nearby schools including Highlander Charter School and The Hope Academy.
Ownership History
Date
Name
Owned For
Owner Type
Purchase Details
Closed on
Mar 12, 2004
Sold by
Jimenez Jose R
Bought by
Rosario Digno
Current Estimated Value
Home Financials for this Owner
Home Financials are based on the most recent Mortgage that was taken out on this home.
Original Mortgage
$128,800
Interest Rate
5.67%
Mortgage Type
Purchase Money Mortgage
Purchase Details
Closed on
Jul 1, 2003
Sold by
White Mary M and Moore Bernice
Bought by
Jimenez Jose R
Home Financials for this Owner
Home Financials are based on the most recent Mortgage that was taken out on this home.
Original Mortgage
$102,900
Interest Rate
5.53%
Mortgage Type
Purchase Money Mortgage
Purchase Details
Closed on
Jun 7, 2001
Sold by
Ne Properties
Bought by
White Mary M and Moore Bernice
Purchase Details
Closed on
Mar 1, 2001
Sold by
Kirk John Joseph
Bought by
N E Prop
Create a Home Valuation Report for This Property
The Home Valuation Report is an in-depth analysis detailing your home's value as well as a comparison with similar homes in the area
Home Values in the Area
Average Home Value in this Area
Purchase History
| Date | Buyer | Sale Price | Title Company |
|---|---|---|---|
| Rosario Digno | $161,000 | -- | |
| Jimenez Jose R | $88,000 | -- | |
| White Mary M | $85,000 | -- | |
| N E Prop | $36,000 | -- |
Source: Public Records
Mortgage History
| Date | Status | Borrower | Loan Amount |
|---|---|---|---|
| Open | N E Prop | $189,000 | |
| Closed | N E Prop | $128,800 | |
| Closed | N E Prop | $32,200 | |
| Previous Owner | N E Prop | $102,900 |
Source: Public Records
Tax History
| Year | Tax Paid | Tax Assessment Tax Assessment Total Assessment is a certain percentage of the fair market value that is determined by local assessors to be the total taxable value of land and additions on the property. | Land | Improvement |
|---|---|---|---|---|
| 2025 | $2,774 | $330,200 | $118,800 | $211,400 |
| 2024 | $4,688 | $255,500 | $75,300 | $180,200 |
| 2023 | $4,688 | $255,500 | $75,300 | $180,200 |
| 2022 | $4,548 | $255,500 | $75,300 | $180,200 |
| 2021 | $4,038 | $164,400 | $33,200 | $131,200 |
| 2020 | $4,038 | $164,400 | $33,200 | $131,200 |
| 2019 | $4,038 | $164,400 | $33,200 | $131,200 |
| 2018 | $3,452 | $108,000 | $30,200 | $77,800 |
| 2017 | $3,452 | $108,000 | $30,200 | $77,800 |
| 2016 | $3,452 | $108,000 | $30,200 | $77,800 |
| 2015 | $3,469 | $104,800 | $30,200 | $74,600 |
| 2014 | $3,537 | $104,800 | $30,200 | $74,600 |
| 2013 | $3,537 | $104,800 | $30,200 | $74,600 |
Source: Public Records
Map
Nearby Homes
- 55 Homer St
- 77 Payton St
- 52 Cactus St
- 183 Baker St
- 61 Cyr St
- 139 Babcock St
- 286 California Ave
- 162 Verndale Ave
- 255 Ohio Ave
- 390 Montgomery Ave
- 233 California Ave
- 273 Montgomery Ave
- 208 California Ave
- 274 Montgomery Ave
- 133 Byfield St
- 358 Northup St
- 180 Ohio Ave
- 325 Northup St
- 160 Ohio Ave
- 34 Savings St
Your Personal Tour Guide
Ask me questions while you tour the home.