Estimated Value: $1,340,000 - $1,505,647
4
Beds
3
Baths
3,468
Sq Ft
$415/Sq Ft
Est. Value
About This Home
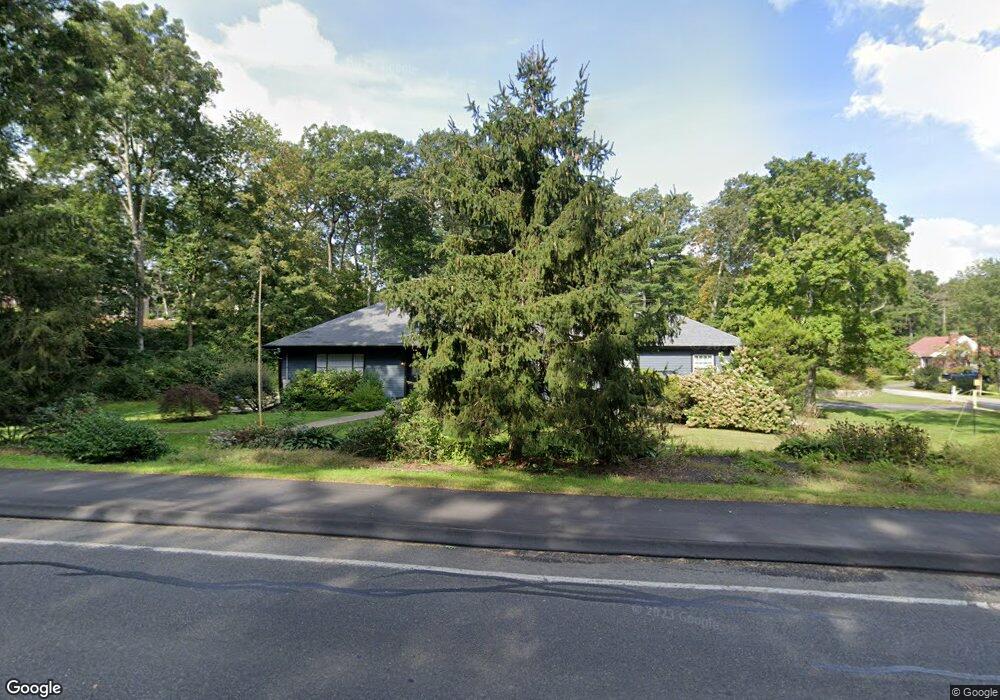
This home is located at 71 Centre St, Dover, MA 02030 and is currently estimated at $1,438,412, approximately $414 per square foot. 71 Centre St is a home located in Norfolk County with nearby schools including Chickering Elementary School, Dover-Sherborn Regional Middle School, and Dover-Sherborn Regional High School.
Ownership History
Date
Name
Owned For
Owner Type
Purchase Details
Closed on
Sep 16, 2003
Sold by
Schellhorn John and Mcgovern Susan R
Bought by
Barnes Mark D and Barnes Lynda
Current Estimated Value
Home Financials for this Owner
Home Financials are based on the most recent Mortgage that was taken out on this home.
Original Mortgage
$500,000
Outstanding Balance
$227,885
Interest Rate
6.22%
Mortgage Type
Purchase Money Mortgage
Estimated Equity
$1,210,527
Create a Home Valuation Report for This Property
The Home Valuation Report is an in-depth analysis detailing your home's value as well as a comparison with similar homes in the area
Home Values in the Area
Average Home Value in this Area
Purchase History
| Date | Buyer | Sale Price | Title Company |
|---|---|---|---|
| Barnes Mark D | $718,000 | -- | |
| Barnes Mark D | $718,000 | -- |
Source: Public Records
Mortgage History
| Date | Status | Borrower | Loan Amount |
|---|---|---|---|
| Open | Barnes Mark D | $500,000 | |
| Closed | Barnes Mark D | $500,000 |
Source: Public Records
Tax History
| Year | Tax Paid | Tax Assessment Tax Assessment Total Assessment is a certain percentage of the fair market value that is determined by local assessors to be the total taxable value of land and additions on the property. | Land | Improvement |
|---|---|---|---|---|
| 2025 | $13,769 | $1,221,700 | $586,600 | $635,100 |
| 2024 | $12,826 | $1,170,300 | $586,600 | $583,700 |
| 2023 | $12,854 | $1,054,500 | $512,000 | $542,500 |
| 2022 | $11,450 | $921,900 | $469,300 | $452,600 |
| 2021 | $10,937 | $848,500 | $405,300 | $443,200 |
| 2020 | $10,519 | $819,200 | $405,300 | $413,900 |
| 2019 | $10,592 | $819,200 | $405,300 | $413,900 |
| 2018 | $10,167 | $791,800 | $405,300 | $386,500 |
| 2017 | $10,024 | $768,100 | $352,000 | $416,100 |
| 2016 | $8,864 | $688,200 | $341,300 | $346,900 |
| 2015 | $9,248 | $728,200 | $373,300 | $354,900 |
Source: Public Records
Map
Nearby Homes
Your Personal Tour Guide
Ask me questions while you tour the home.