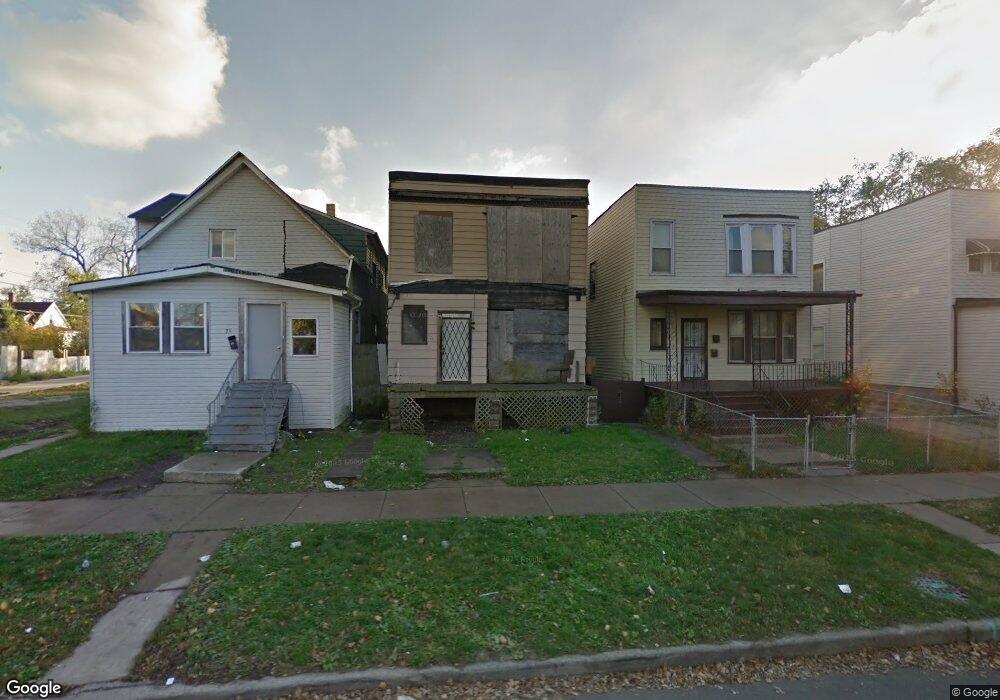
71 E 100th Place Chicago, IL 60628
Roseland NeighborhoodEstimated Value: $187,100 - $203,000
2
Beds
2
Baths
2,010
Sq Ft
$97/Sq Ft
Est. Value
About This Home
This home is located at 71 E 100th Place, Chicago, IL 60628 and is currently estimated at $195,050, approximately $97 per square foot. 71 E 100th Place is a home located in Cook County with nearby schools including Bennett Elementary School, Harlan Community Academy High School, and St. John de la Salle School.
Ownership History
Date
Name
Owned For
Owner Type
Purchase Details
Closed on
Jul 29, 2009
Sold by
Orr David D
Bought by
Kelly Aneidra C
Current Estimated Value
Purchase Details
Closed on
Mar 5, 2008
Sold by
Greenwich Capital Financial Products Inc
Bought by
Petra Finance Llc
Purchase Details
Closed on
Oct 5, 2006
Sold by
Cade Kimberly
Bought by
Greenwich Capital Financial Products Inc
Purchase Details
Closed on
Apr 12, 2005
Sold by
Ford Robert L
Bought by
Cade Kimberly
Home Financials for this Owner
Home Financials are based on the most recent Mortgage that was taken out on this home.
Original Mortgage
$116,450
Interest Rate
7.95%
Mortgage Type
Commercial
Purchase Details
Closed on
Oct 31, 2002
Sold by
Shelton Bartimacus
Bought by
Ford Robert
Home Financials for this Owner
Home Financials are based on the most recent Mortgage that was taken out on this home.
Original Mortgage
$90,000
Interest Rate
6.25%
Mortgage Type
Commercial
Purchase Details
Closed on
Dec 12, 2001
Sold by
Coleman David
Bought by
Shelton Bartimaeus
Create a Home Valuation Report for This Property
The Home Valuation Report is an in-depth analysis detailing your home's value as well as a comparison with similar homes in the area
Home Values in the Area
Average Home Value in this Area
Purchase History
| Date | Buyer | Sale Price | Title Company |
|---|---|---|---|
| Kelly Aneidra C | -- | None Available | |
| Petra Finance Llc | -- | None Available | |
| Greenwich Capital Financial Products Inc | -- | None Available | |
| Cade Kimberly | $137,000 | Lawyers Title Insurance Corp | |
| Ford Robert | $100,000 | Law Title | |
| Shelton Bartimaeus | -- | -- |
Source: Public Records
Mortgage History
| Date | Status | Borrower | Loan Amount |
|---|---|---|---|
| Previous Owner | Cade Kimberly | $116,450 | |
| Previous Owner | Ford Robert | $90,000 |
Source: Public Records
Tax History
| Year | Tax Paid | Tax Assessment Tax Assessment Total Assessment is a certain percentage of the fair market value that is determined by local assessors to be the total taxable value of land and additions on the property. | Land | Improvement |
|---|---|---|---|---|
| 2025 | $472 | $2,062 | $2,062 | -- |
| 2024 | $472 | $2,062 | $2,062 | -- |
| 2023 | $461 | $2,234 | $2,234 | -- |
| 2022 | $461 | $2,234 | $2,234 | $0 |
| 2021 | $451 | $2,234 | $2,234 | $0 |
| 2020 | $499 | $2,234 | $2,234 | $0 |
| 2019 | $450 | $2,234 | $2,234 | $0 |
| 2018 | $2,264 | $11,435 | $2,234 | $9,201 |
| 2017 | $3,226 | $14,954 | $2,062 | $12,892 |
| 2016 | $3,002 | $14,954 | $2,062 | $12,892 |
| 2015 | $2,747 | $14,954 | $2,062 | $12,892 |
| 2014 | $2,357 | $12,674 | $1,718 | $10,956 |
| 2013 | $2,310 | $12,674 | $1,718 | $10,956 |
Source: Public Records
Map
Nearby Homes
- 76 E 100th Place
- 70 E 100th Place
- 54 E 101st St
- 10046 S Indiana Ave
- 26 E 101st Place
- 24 E 99th Place
- 10052 S Lafayette Ave
- 9904 S State St Unit B
- 65 E 102nd Place
- 10117 S Perry Ave
- 10035 S La Salle St
- 10205 S Perry Ave
- 10047 S Calumet Ave
- 10029 S Wentworth Ave
- 10214 S La Salle St
- 10229 S Calumet Ave
- 10020 S Wentworth Ave
- 10110 S Yale Ave
- 10238 S Wentworth Ave
- 10211 S Yale Ave
- 71 E 100th Place
- 69 E 100th Place
- 69 E 100th Place Unit 2
- 73 E 100th Place
- 63 E 100th St
- 63 E 100th Place
- 75 E 100th Place
- 70 E 101st St
- 72 E 101st St
- 76 E 101st St
- 68 E 101st St
- 74 E 100th Place
- 74 E 100th Place
- 10034 S Michigan Ave
- 66 E 100th Place
- 62 E 101st St
- 80 E 101st St Unit 1
- 80 E 101st St
- 10038 S Michigan Ave
- 62 E 100th Place
Your Personal Tour Guide
Ask me questions while you tour the home.