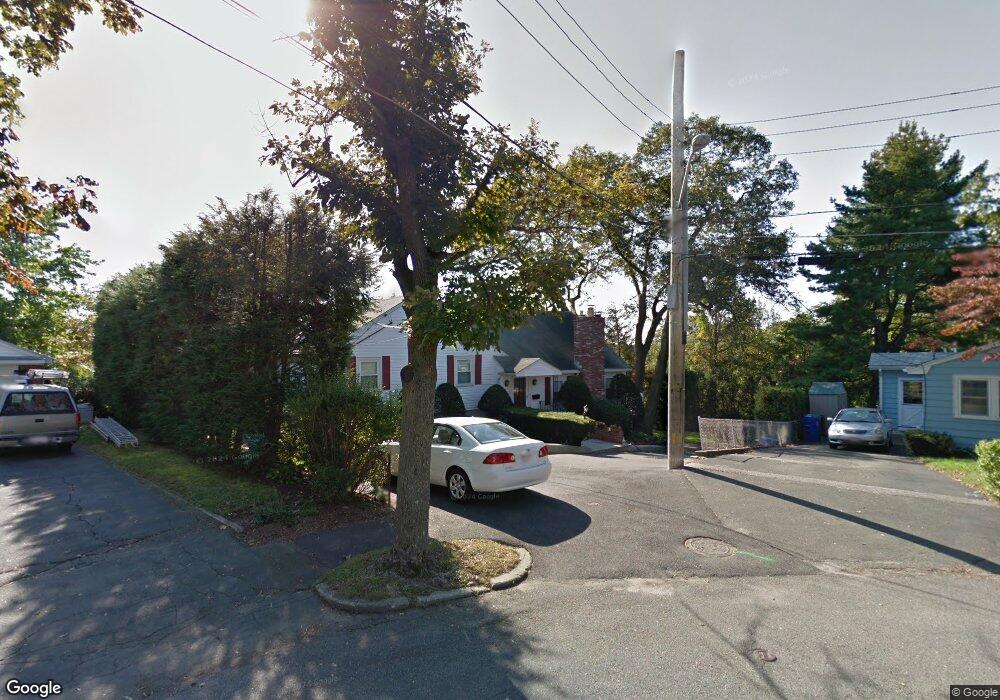
71 James St West Newton, MA 02465
West Newton NeighborhoodEstimated Value: $1,232,000 - $1,527,991
4
Beds
3
Baths
2,048
Sq Ft
$683/Sq Ft
Est. Value
About This Home
This home is located at 71 James St, West Newton, MA 02465 and is currently estimated at $1,399,248, approximately $683 per square foot. 71 James St is a home located in Middlesex County with nearby schools including C.C. Burr, Franklin Elementary School, and F.A. Day Middle School.
Ownership History
Date
Name
Owned For
Owner Type
Purchase Details
Closed on
Jan 21, 2021
Sold by
Chan Paul K and Chan Suzanne S
Bought by
Chan Suzanne S
Current Estimated Value
Home Financials for this Owner
Home Financials are based on the most recent Mortgage that was taken out on this home.
Original Mortgage
$510,000
Outstanding Balance
$453,235
Interest Rate
2.6%
Mortgage Type
New Conventional
Estimated Equity
$946,014
Purchase Details
Closed on
Jun 7, 2017
Sold by
Chan Paul K
Bought by
Chan Paul K and Chan Suzanne S
Purchase Details
Closed on
Jul 1, 1985
Bought by
Chan Paul K and Chan Anne K
Create a Home Valuation Report for This Property
The Home Valuation Report is an in-depth analysis detailing your home's value as well as a comparison with similar homes in the area
Home Values in the Area
Average Home Value in this Area
Purchase History
| Date | Buyer | Sale Price | Title Company |
|---|---|---|---|
| Chan Suzanne S | -- | None Available | |
| Chan Paul K | -- | -- | |
| Chan Paul K | $197,000 | -- |
Source: Public Records
Mortgage History
| Date | Status | Borrower | Loan Amount |
|---|---|---|---|
| Open | Chan Suzanne S | $510,000 | |
| Previous Owner | Chan Paul K | $200,000 | |
| Previous Owner | Chan Paul K | $140,000 | |
| Previous Owner | Chan Paul K | $53,000 |
Source: Public Records
Tax History Compared to Growth
Tax History
| Year | Tax Paid | Tax Assessment Tax Assessment Total Assessment is a certain percentage of the fair market value that is determined by local assessors to be the total taxable value of land and additions on the property. | Land | Improvement |
|---|---|---|---|---|
| 2025 | $13,730 | $1,401,000 | $869,600 | $531,400 |
| 2024 | $13,276 | $1,360,200 | $844,300 | $515,900 |
| 2023 | $12,445 | $1,222,500 | $649,100 | $573,400 |
| 2022 | $11,908 | $1,131,900 | $601,000 | $530,900 |
| 2021 | $11,490 | $1,067,800 | $567,000 | $500,800 |
| 2020 | $11,148 | $1,067,800 | $567,000 | $500,800 |
| 2019 | $10,834 | $1,036,700 | $550,500 | $486,200 |
| 2018 | $9,828 | $908,300 | $498,600 | $409,700 |
| 2017 | $9,529 | $856,900 | $470,400 | $386,500 |
| 2016 | $9,113 | $800,800 | $439,600 | $361,200 |
| 2015 | $8,689 | $748,400 | $410,800 | $337,600 |
Source: Public Records
Map
Nearby Homes
- 265-267 River St Unit 267
- 265-267 River St Unit 265
- 33 Lill Ave
- 101-103 Lexington St
- 56 Dearborn St
- 44 Westland Ave
- 31-37 Washington Ave
- 24 Tolman St Unit A
- 25 Tolman St Unit 2
- 90 Auburndale Ave
- 14 Cottage Place Unit 14
- 73 Orange St Unit 2
- 287 Cherry St Unit 2
- 5-7 Chester Ave
- 106 River St Unit 18
- 106 River St Unit 2
- 106 River St Unit 14
- 2 Elm St Unit 6
- 2 Elm St Unit 8
- 160 Pine St Unit 12