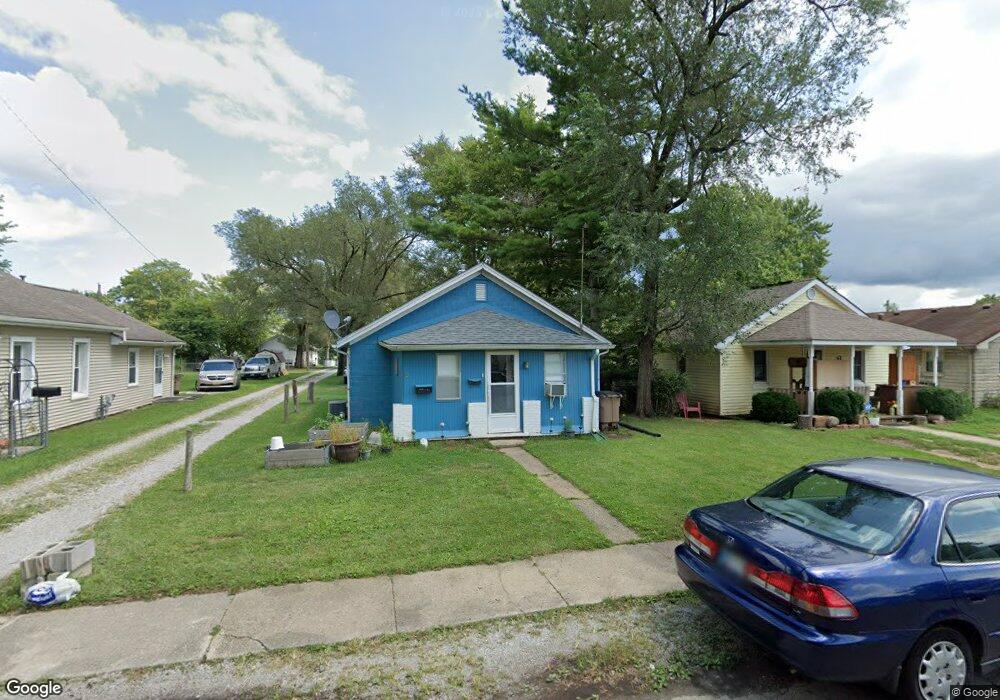
71 N Ross St Columbus, IN 47201
Estimated Value: $128,000 - $178,000
1
Bed
1
Bath
1,524
Sq Ft
$100/Sq Ft
Est. Value
About This Home
This home is located at 71 N Ross St, Columbus, IN 47201 and is currently estimated at $153,036, approximately $100 per square foot. 71 N Ross St is a home located in Bartholomew County with nearby schools including Clifty Creek Elementary School, Central Middle School, and Columbus East High School.
Ownership History
Date
Name
Owned For
Owner Type
Purchase Details
Closed on
Dec 10, 2019
Sold by
Jamie Bush
Bought by
Maria Jose
Current Estimated Value
Home Financials for this Owner
Home Financials are based on the most recent Mortgage that was taken out on this home.
Interest Rate
3.68%
Purchase Details
Closed on
Nov 11, 2019
Sold by
Spray Marshall Est
Bought by
Spray Steve
Home Financials for this Owner
Home Financials are based on the most recent Mortgage that was taken out on this home.
Interest Rate
3.68%
Create a Home Valuation Report for This Property
The Home Valuation Report is an in-depth analysis detailing your home's value as well as a comparison with similar homes in the area
Home Values in the Area
Average Home Value in this Area
Purchase History
| Date | Buyer | Sale Price | Title Company |
|---|---|---|---|
| Maria Jose | $8,300 | -- | |
| Spray Steve | $5,108 | -- |
Source: Public Records
Mortgage History
| Date | Status | Borrower | Loan Amount |
|---|---|---|---|
| Closed | Maria Jose | -- |
Source: Public Records
Tax History Compared to Growth
Tax History
| Year | Tax Paid | Tax Assessment Tax Assessment Total Assessment is a certain percentage of the fair market value that is determined by local assessors to be the total taxable value of land and additions on the property. | Land | Improvement |
|---|---|---|---|---|
| 2024 | $838 | $100,700 | $18,600 | $82,100 |
| 2023 | $709 | $93,100 | $18,600 | $74,500 |
| 2022 | $678 | $85,100 | $18,600 | $66,500 |
| 2021 | $501 | $72,500 | $9,600 | $62,900 |
| 2020 | $394 | $55,500 | $9,600 | $45,900 |
| 2019 | $328 | $49,400 | $9,600 | $39,800 |
| 2018 | $326 | $49,400 | $9,600 | $39,800 |
| 2017 | $481 | $72,300 | $9,300 | $63,000 |
| 2016 | $454 | $69,800 | $9,300 | $60,500 |
| 2014 | $463 | $69,500 | $9,300 | $60,200 |
Source: Public Records
Map
Nearby Homes
- 41 N Ross St
- 2651 Clifty St
- 51 S Brooks St
- 41 N Cherry St
- 2263 Wallace Ave
- 2905 Kentucky Ave
- 507 N Cherry St
- 2032 Indiana Ave
- 2041 Mckinley Ave
- 661 Smith St
- 213 Hege Ave
- 758 N Cherry St
- 2921 10th St
- 342 Jones St
- 212 S Beatty St
- 1631 Kentucky Ave
- 52 N Hinman St
- 2035 10th St
- 1521 Indiana Ave
- 757 Fairview Dr