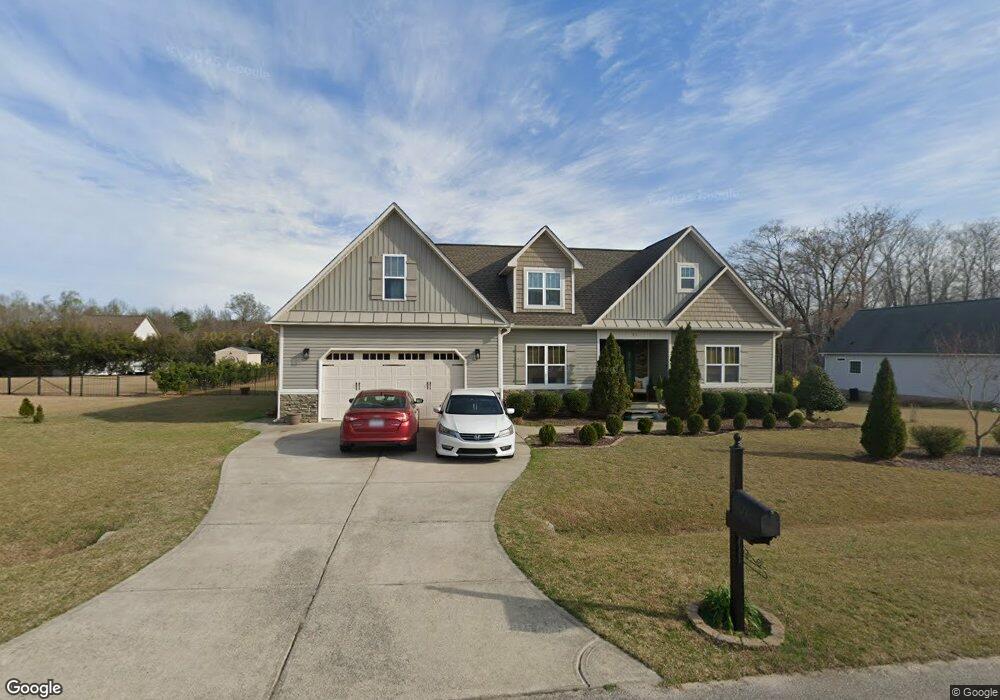
71 Smithsanders Ct Unit 31 Smithfield, NC 27577
Cleveland NeighborhoodEstimated Value: $460,000 - $488,744
4
Beds
3
Baths
2,365
Sq Ft
$198/Sq Ft
Est. Value
About This Home
This home is located at 71 Smithsanders Ct Unit 31, Smithfield, NC 27577 and is currently estimated at $469,186, approximately $198 per square foot. 71 Smithsanders Ct Unit 31 is a home located in Johnston County with nearby schools including Polenta Elementary School, Swift Creek Middle, and Cleveland High School.
Ownership History
Date
Name
Owned For
Owner Type
Purchase Details
Closed on
Aug 1, 2025
Sold by
Stilwell Larry W
Bought by
Santangelo Robin K and Santangelo Michael R
Current Estimated Value
Home Financials for this Owner
Home Financials are based on the most recent Mortgage that was taken out on this home.
Original Mortgage
$441,750
Outstanding Balance
$441,371
Interest Rate
6.77%
Mortgage Type
New Conventional
Estimated Equity
$27,815
Purchase Details
Closed on
May 28, 2013
Sold by
Darryl D Evans Inc
Bought by
Stilwell Larry W
Home Financials for this Owner
Home Financials are based on the most recent Mortgage that was taken out on this home.
Original Mortgage
$216,750
Interest Rate
3.62%
Mortgage Type
FHA
Purchase Details
Closed on
Feb 7, 2013
Sold by
Carriage Creek Llc
Bought by
Darryl D Evans Inc
Purchase Details
Closed on
Nov 19, 2012
Sold by
Carriage Creek Llc
Bought by
Darryl D Evans Inc
Create a Home Valuation Report for This Property
The Home Valuation Report is an in-depth analysis detailing your home's value as well as a comparison with similar homes in the area
Home Values in the Area
Average Home Value in this Area
Purchase History
| Date | Buyer | Sale Price | Title Company |
|---|---|---|---|
| Santangelo Robin K | $465,000 | None Listed On Document | |
| Stilwell Larry W | $221,000 | None Available | |
| Darryl D Evans Inc | -- | None Available | |
| Darryl D Evans Inc | $105,000 | None Available |
Source: Public Records
Mortgage History
| Date | Status | Borrower | Loan Amount |
|---|---|---|---|
| Open | Santangelo Robin K | $441,750 | |
| Previous Owner | Stilwell Larry W | $216,750 |
Source: Public Records
Tax History Compared to Growth
Tax History
| Year | Tax Paid | Tax Assessment Tax Assessment Total Assessment is a certain percentage of the fair market value that is determined by local assessors to be the total taxable value of land and additions on the property. | Land | Improvement |
|---|---|---|---|---|
| 2025 | $2,548 | $401,280 | $70,000 | $331,280 |
| 2024 | $2,000 | $246,890 | $42,000 | $204,890 |
| 2023 | $1,932 | $246,890 | $42,000 | $204,890 |
| 2022 | $2,031 | $246,890 | $42,000 | $204,890 |
| 2021 | $2,031 | $246,890 | $42,000 | $204,890 |
| 2020 | $2,055 | $246,890 | $42,000 | $204,890 |
| 2019 | $2,055 | $246,890 | $42,000 | $204,890 |
| 2018 | $1,888 | $221,480 | $29,000 | $192,480 |
| 2017 | $1,888 | $221,480 | $29,000 | $192,480 |
| 2016 | $1,888 | $221,480 | $29,000 | $192,480 |
| 2015 | $1,888 | $221,480 | $29,000 | $192,480 |
| 2014 | $1,888 | $221,480 | $29,000 | $192,480 |
Source: Public Records
Map
Nearby Homes
- 100 Brodie Rose Landing Way
- 41 Brodie Rose Landing Way
- 250 Brodie Rose Landing Way
- Colfax Plan at High Springs
- Roanoke Plan at High Springs
- Cooper Plan at High Springs
- Davidson Plan at High Springs
- Asheboro Plan at High Springs
- McDowell Plan at High Springs
- Waverly Plan at High Springs
- 79 Quail Point Cir
- 80 Independence Dr
- 386 Rising Star Dr
- 192 Quail Point Cir
- 55 Black Horse Way
- 681 Polenta Rd
- 433 Steel Bridge Rd
- 15 Independence Dr
- 2411 Freedom Rd
- 26 Union City Ct
- 45 Smithsanders Ct Unit Lot30
- 45 Smithsanders Ct
- 95 Smithsanders Ct
- 157 Carriage Creek Dr Unit 26
- 157 Carriage Creek Dr
- 183 Carriage Creek Dr
- 183 Carriage Creek Dr Unit 27
- 70 Smithsanders Ct Unit 37
- 46 Smithsanders Ct Unit 38
- 19 Smithsanders Ct
- 96 Smithsanders Ct Unit Lot36
- 227 Carriage Creek Dr Unit Lt28
- 227 Carriage Creek Dr
- 107 Smithsanders Ct Unit 33
- 133 Carriage Creek Dr
- 20 Smithsanders Ct Unit Lt39
- 20 Smithsanders Ct
- 112 Smithsanders Ct Unit 34
- 108 Smithsanders Ct
- 108 Smithsanders Ct Unit 35