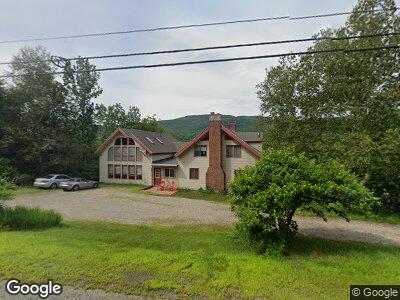
71 State Route 2 Shelburne, NH 03581
Estimated Value: $388,170 - $494,000
4
Beds
4
Baths
4,376
Sq Ft
$102/Sq Ft
Est. Value
About This Home
This home is located at 71 State Route 2, Shelburne, NH 03581 and is currently estimated at $445,543, approximately $101 per square foot. 71 State Route 2 is a home located in Coos County with nearby schools including Edward Fenn Elementary School, Gorham Middle School, and Gorham High School.
Ownership History
Date
Name
Owned For
Owner Type
Purchase Details
Closed on
Jun 11, 2024
Sold by
Corrigan Jennifer J
Bought by
Jenniifer Corrigan Ret and Corrigan
Current Estimated Value
Purchase Details
Closed on
Sep 9, 2023
Sold by
Corrigan Gregory T
Bought by
Corrigan Jennifer J
Purchase Details
Closed on
Jan 25, 2020
Sold by
Giovagnoli Eric
Bought by
Corrigan Gregory R and Corrigan Jennifer J
Home Financials for this Owner
Home Financials are based on the most recent Mortgage that was taken out on this home.
Original Mortgage
$188,500
Interest Rate
3.73%
Mortgage Type
New Conventional
Purchase Details
Closed on
May 31, 2019
Sold by
Collins Carol J
Bought by
Giovagnoli Eric
Home Financials for this Owner
Home Financials are based on the most recent Mortgage that was taken out on this home.
Original Mortgage
$155,000
Interest Rate
4.1%
Mortgage Type
New Conventional
Create a Home Valuation Report for This Property
The Home Valuation Report is an in-depth analysis detailing your home's value as well as a comparison with similar homes in the area
Home Values in the Area
Average Home Value in this Area
Purchase History
| Date | Buyer | Sale Price | Title Company |
|---|---|---|---|
| Jenniifer Corrigan Ret | -- | None Available | |
| Jenniifer Corrigan Ret | -- | None Available | |
| Corrigan Jennifer J | -- | None Available | |
| Corrigan Jennifer J | -- | None Available | |
| Corrigan Gregory R | $198,533 | None Available | |
| Corrigan Gregory R | $198,533 | None Available | |
| Giovagnoli Eric | $175,000 | -- | |
| Giovagnoli Eric | $175,000 | -- |
Source: Public Records
Mortgage History
| Date | Status | Borrower | Loan Amount |
|---|---|---|---|
| Previous Owner | Corrigan Gregory R | $188,500 | |
| Previous Owner | Giovagnoli Eric | $155,000 | |
| Previous Owner | Collins Paul J | $50,000 | |
| Previous Owner | Collins Paul J | $80,000 |
Source: Public Records
Tax History Compared to Growth
Tax History
| Year | Tax Paid | Tax Assessment Tax Assessment Total Assessment is a certain percentage of the fair market value that is determined by local assessors to be the total taxable value of land and additions on the property. | Land | Improvement |
|---|---|---|---|---|
| 2024 | $4,785 | $252,500 | $53,900 | $198,600 |
| 2023 | $4,447 | $252,500 | $53,900 | $198,600 |
| 2022 | $3,858 | $252,500 | $53,900 | $198,600 |
| 2021 | $4,051 | $249,300 | $53,900 | $195,400 |
| 2020 | $4,289 | $272,500 | $31,000 | $241,500 |
| 2019 | $4,207 | $272,500 | $31,000 | $241,500 |
| 2018 | $4,066 | $265,200 | $31,000 | $234,200 |
| 2017 | $4,153 | $265,200 | $31,000 | $234,200 |
| 2016 | $4,132 | $265,200 | $31,000 | $234,200 |
| 2015 | $4,568 | $293,200 | $50,400 | $242,800 |
| 2014 | $4,542 | $293,200 | $50,400 | $242,800 |
| 2013 | $4,483 | $293,200 | $50,400 | $242,800 |
Source: Public Records
Map
Nearby Homes
- 39 Washington St
- 4 Power House Acres Rd
- 5 Bell St
- 17 Mill St
- 55 Main St
- 11 Alpine St
- 18 Corbin Ave
- 21 Promenade St
- 5 Wilfred St
- 113 Glen Rd
- 240 Main St
- 0 Dublin St
- 64 Evans St
- 215 & 221 Main St
- 6 Evergreen Dr
- 12 Evergreen Dr
- 141 Lancaster Rd Unit TRLR 20
- 141 Lancaster Rd Unit 4
- 141 Lancaster Rd Unit 24
- 986 State Route 2
- 71 State Route 2
- 71 State Route 2
- 71 U S 2
- 70 State Route 2
- 23 Labrador Run
- 92 State Route 2
- 86 State Route 2
- 86 U S Route 2
- 86 U S 2
- 56 State Route 2
- 19 Peabrook Rd
- 110 State Route 2
- 110 State Route 2
- 110 State Route 2
- 4 Green Acres
- 20 Green Acres
- 1 Birch Hill Dr
- 126 State Route 2
- 141 U S 2
- 141 State Route 2