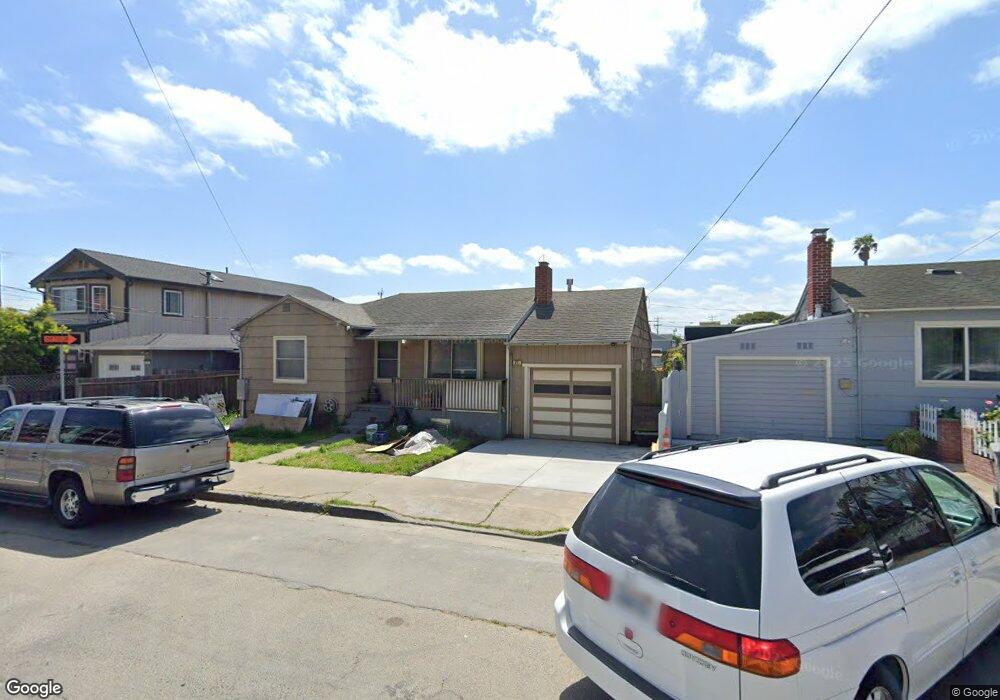
71 Tanforan Ave San Bruno, CA 94066
San Bruno Park NeighborhoodEstimated Value: $861,000 - $1,031,656
2
Beds
1
Bath
1,160
Sq Ft
$800/Sq Ft
Est. Value
About This Home
This home is located at 71 Tanforan Ave, San Bruno, CA 94066 and is currently estimated at $927,664, approximately $799 per square foot. 71 Tanforan Ave is a home located in San Mateo County with nearby schools including Belle Air Elementary School, Parkside Intermediate School, and Capuchino High School.
Ownership History
Date
Name
Owned For
Owner Type
Purchase Details
Closed on
Jan 21, 2021
Sold by
Studulski James P
Bought by
James P Studulski Revocable Living Trust and Studulski
Current Estimated Value
Purchase Details
Closed on
Jul 24, 2020
Sold by
Studulski Tracy Lynn Rochette
Bought by
Studulski James P
Home Financials for this Owner
Home Financials are based on the most recent Mortgage that was taken out on this home.
Original Mortgage
$273,000
Interest Rate
3.1%
Mortgage Type
New Conventional
Purchase Details
Closed on
Aug 14, 2013
Sold by
Studulski Tracy Lynn Rochette
Bought by
Studulski James P
Home Financials for this Owner
Home Financials are based on the most recent Mortgage that was taken out on this home.
Original Mortgage
$248,000
Interest Rate
4.28%
Mortgage Type
New Conventional
Purchase Details
Closed on
Oct 13, 2009
Sold by
Ross Laurie
Bought by
Studulski Steven and Studulski Carren
Create a Home Valuation Report for This Property
The Home Valuation Report is an in-depth analysis detailing your home's value as well as a comparison with similar homes in the area
Home Values in the Area
Average Home Value in this Area
Purchase History
| Date | Buyer | Sale Price | Title Company |
|---|---|---|---|
| James P Studulski Revocable Living Trust | -- | None Listed On Document | |
| Studulski James P | -- | Chicago Title Company | |
| Studulski James P | -- | Fidelity National Title Co | |
| Studulski James P | $310,000 | Fidelity National Title Co | |
| Studulski Steven | $285,500 | Cornerstone Title Company |
Source: Public Records
Mortgage History
| Date | Status | Borrower | Loan Amount |
|---|---|---|---|
| Previous Owner | Studulski James P | $273,000 | |
| Previous Owner | Studulski James P | $248,000 |
Source: Public Records
Tax History Compared to Growth
Tax History
| Year | Tax Paid | Tax Assessment Tax Assessment Total Assessment is a certain percentage of the fair market value that is determined by local assessors to be the total taxable value of land and additions on the property. | Land | Improvement |
|---|---|---|---|---|
| 2025 | $5,008 | $380,002 | $190,001 | $190,001 |
| 2023 | $5,008 | $365,248 | $182,624 | $182,624 |
| 2022 | $3,957 | $358,088 | $179,044 | $179,044 |
| 2021 | $3,904 | $351,068 | $175,534 | $175,534 |
| 2020 | $3,867 | $347,470 | $173,735 | $173,735 |
| 2019 | $3,804 | $340,658 | $170,329 | $170,329 |
| 2018 | $3,616 | $333,980 | $166,990 | $166,990 |
| 2017 | $3,576 | $327,432 | $163,716 | $163,716 |
| 2016 | $3,496 | $321,012 | $160,506 | $160,506 |
| 2015 | $3,449 | $316,192 | $158,096 | $158,096 |
| 2014 | $3,398 | $310,000 | $155,000 | $155,000 |
Source: Public Records
Map
Nearby Homes
- 69 Atlantic Ave
- 56 Scott St
- 1078 Montgomery Ave
- 917 Mills Ave
- 959 Easton Ave
- 871 Green Ave
- 873 7th Ave
- 214 Manor Dr
- 774 Acacia Ave
- 20 Maple Ave
- 322 Commercial Ave
- 103 Piccadilly Place Unit A
- 577 5th Ave
- 123 Piccadilly Place Unit F
- 1031 Cherry Ave Unit 20
- 1031 Cherry Ave Unit 33
- 453 Grand Ave
- 219 Miller Ave
- 408 Boardwalk Ave Unit 1
- 632 1st Ln
- 75 Tanforan Ave
- 67 Tanforan Ave
- 77 Tanforan Ave
- 83 Tanforan Ave
- 61 Tanforan Ave
- 86 Pacific Ave
- 80 Pacific Ave
- 1269 Herman St
- 57 Tanforan Ave
- 68 Pacific Ave
- 1275 Herman St
- 1289 Herman St
- 1251 Herman St
- 53 Tanforan Ave
- 60 Pacific Ave
- 45 Tanforan Ave
- 93 Pacific Ave
- 81 Pacific Ave
- 75 Pacific Ave
- 80 Tanforan Ave Unit 11