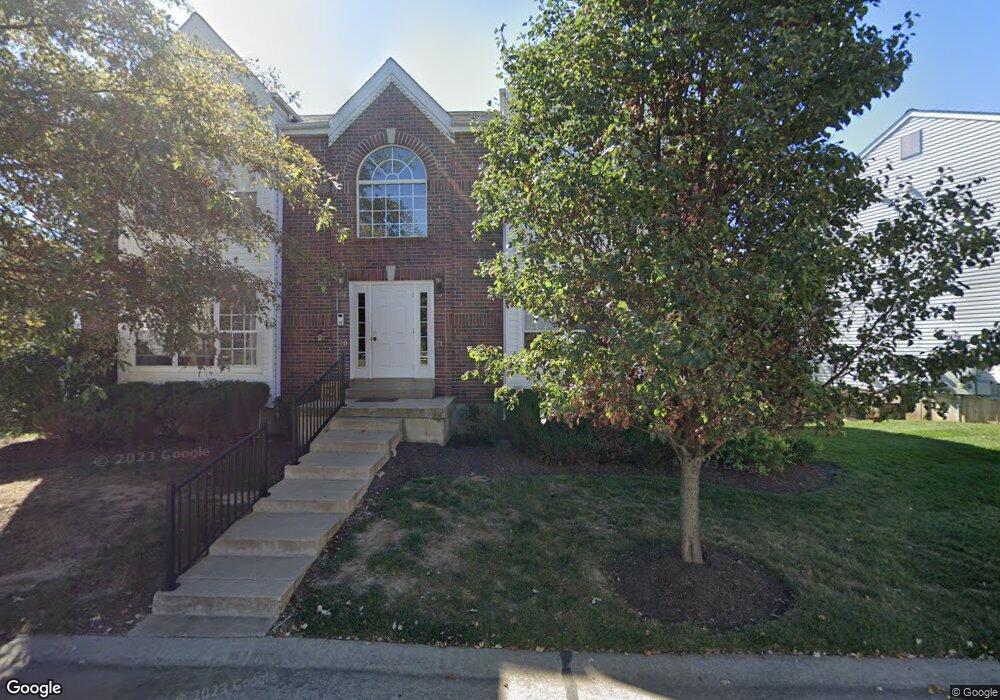
71 Timber Oaks Trail O Fallon, MO 63368
Estimated Value: $188,499 - $194,000
2
Beds
2
Baths
985
Sq Ft
$194/Sq Ft
Est. Value
About This Home
This home is located at 71 Timber Oaks Trail, O Fallon, MO 63368 and is currently estimated at $191,375, approximately $194 per square foot. 71 Timber Oaks Trail is a home located in St. Charles County with nearby schools including Crossroads Elementary School, Frontier Middle School, and Liberty High School.
Ownership History
Date
Name
Owned For
Owner Type
Purchase Details
Closed on
Jun 23, 2023
Sold by
Holt Zachary D and Holt Demetra B
Bought by
Rhodes Michael James and Rhodes Barbara Jewell
Current Estimated Value
Home Financials for this Owner
Home Financials are based on the most recent Mortgage that was taken out on this home.
Original Mortgage
$171,000
Outstanding Balance
$166,394
Interest Rate
6.35%
Mortgage Type
New Conventional
Estimated Equity
$24,981
Purchase Details
Closed on
May 31, 2013
Sold by
Ruoff Susan D
Bought by
Holt Zachary D and Holt Demetra B
Home Financials for this Owner
Home Financials are based on the most recent Mortgage that was taken out on this home.
Original Mortgage
$68,000
Interest Rate
3.41%
Mortgage Type
New Conventional
Purchase Details
Closed on
Oct 28, 1999
Sold by
Mcbride & Sons Homes Inc
Bought by
Ruoff Susan D
Home Financials for this Owner
Home Financials are based on the most recent Mortgage that was taken out on this home.
Original Mortgage
$70,700
Interest Rate
7.12%
Create a Home Valuation Report for This Property
The Home Valuation Report is an in-depth analysis detailing your home's value as well as a comparison with similar homes in the area
Home Values in the Area
Average Home Value in this Area
Purchase History
| Date | Buyer | Sale Price | Title Company |
|---|---|---|---|
| Rhodes Michael James | -- | Investors Title | |
| Holt Zachary D | $85,000 | Benchmark Title Llc | |
| Ruoff Susan D | -- | -- |
Source: Public Records
Mortgage History
| Date | Status | Borrower | Loan Amount |
|---|---|---|---|
| Open | Rhodes Michael James | $171,000 | |
| Previous Owner | Holt Zachary D | $68,000 | |
| Previous Owner | Ruoff Susan D | $70,700 |
Source: Public Records
Tax History
| Year | Tax Paid | Tax Assessment Tax Assessment Total Assessment is a certain percentage of the fair market value that is determined by local assessors to be the total taxable value of land and additions on the property. | Land | Improvement |
|---|---|---|---|---|
| 2025 | $1,853 | $30,539 | -- | -- |
| 2023 | $1,854 | $26,708 | $0 | $0 |
| 2022 | $1,624 | $21,759 | $0 | $0 |
| 2021 | $1,628 | $21,759 | $0 | $0 |
| 2020 | $1,546 | $19,932 | $0 | $0 |
| 2019 | $1,452 | $19,932 | $0 | $0 |
| 2018 | $1,361 | $17,766 | $0 | $0 |
| 2017 | $1,338 | $17,766 | $0 | $0 |
| 2016 | $1,381 | $17,594 | $0 | $0 |
| 2015 | $1,361 | $17,594 | $0 | $0 |
| 2014 | $1,279 | $17,757 | $0 | $0 |
Source: Public Records
Map
Nearby Homes
- 7839 Town Square Ave
- 7817 Town Square Ave
- 702 Balcarra Dr
- 769 Cypress Knoll Dr
- 518 Old Dominion St
- 1816 Packard Ct
- 1405 Kearney Dr
- 139 Alta Mira Ct
- 624 Hawk Run Dr
- 112 Wake Forest Place
- 131 Wake Forest Place
- 128 Dardenne Place Dr
- 2570 Technology Dr
- 116 Dardenne Place Dr
- 276 Greenshire Ln
- 160 Cedarstone Dr
- 25 Edenshire Ct Unit 67B
- 116 Cedarstone Dr
- 0 Chesapeake @ Cedarstone Unit MAR24063701
- 0 Universal Design @ Cedarstone Unit MAR24063686
- 75 Timber Oaks Trail
- 70 Timber Oaks Trail
- 71 Timber Oaks Trail Unit B
- 71 Timber Oaks Trail Unit 7B
- 75 Timber Oaks Trail Unit D
- 70 Timber Oaks Trail Unit A
- 70 Timber Oaks Trail Unit 7A
- 74 Timber Oaks Trail
- 74 Timber Oaks Trail Unit 7C
- 65 Timber Oaks Trail
- 64 Timber Oaks Trail
- 64 Timber Oaks Trail Unit C
- 50 Timber Oaks Trail
- 50 Timber Oaks Trail Unit 5A
- 61 Timber Oaks Trail Unit B
- 60 Timber Oaks Trail
- 594 Timber Creek Trail
- 104 Timber Creek Dr
- 104 Timber Creek Dr Unit C
- 104 Timber Creek Dr Unit 10C
Your Personal Tour Guide
Ask me questions while you tour the home.