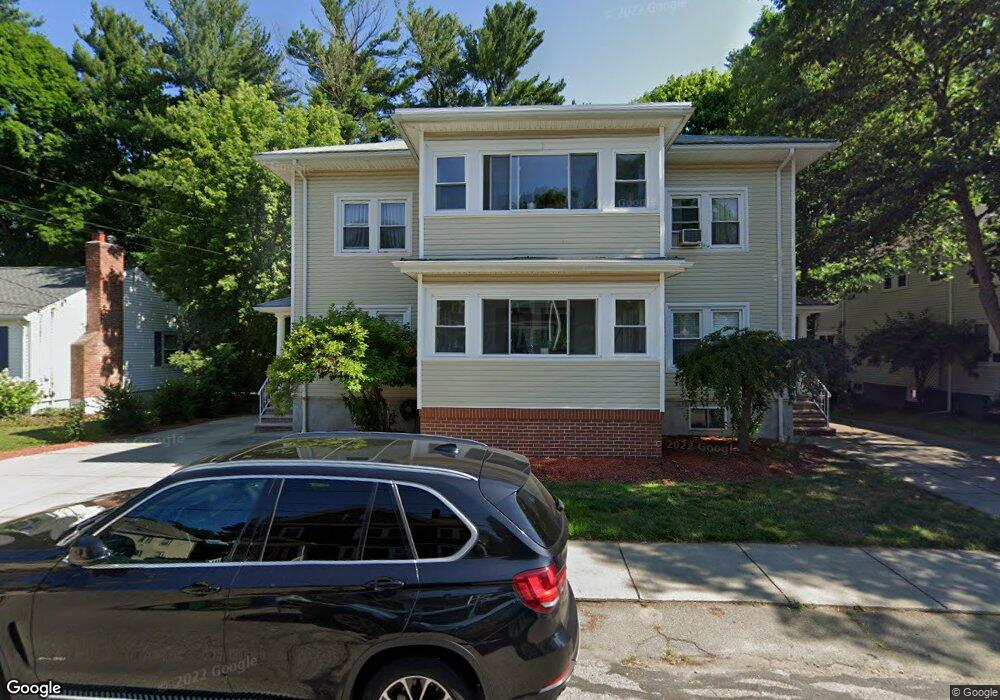
71 Warwick Rd Unit 73 West Newton, MA 02465
West Newton NeighborhoodEstimated Value: $1,197,000 - $1,433,000
6
Beds
2
Baths
2,902
Sq Ft
$471/Sq Ft
Est. Value
About This Home
This home is located at 71 Warwick Rd Unit 73, West Newton, MA 02465 and is currently estimated at $1,365,493, approximately $470 per square foot. 71 Warwick Rd Unit 73 is a home located in Middlesex County with nearby schools including Franklin Elementary School, Horace Mann Elementary School, and F.A. Day Middle School.
Ownership History
Date
Name
Owned For
Owner Type
Purchase Details
Closed on
Sep 16, 2022
Sold by
Huang Gui Z
Bought by
Chan Residence T
Current Estimated Value
Purchase Details
Closed on
Jan 27, 2010
Sold by
Chan Kang Kong
Bought by
Huang Gui Zhen and Chan Kang Kong
Purchase Details
Closed on
Dec 22, 1995
Sold by
Bank Of America Natl T
Bought by
Chan Kang Kong and Huang Gui Zhen
Home Financials for this Owner
Home Financials are based on the most recent Mortgage that was taken out on this home.
Original Mortgage
$192,000
Interest Rate
7.33%
Mortgage Type
Purchase Money Mortgage
Purchase Details
Closed on
Apr 18, 1995
Sold by
Stone Carla F and Hilden Michael M
Bought by
Bankamerica Natl T Co
Purchase Details
Closed on
Sep 15, 1987
Sold by
Blakely Donald E
Bought by
Hiden Michael
Create a Home Valuation Report for This Property
The Home Valuation Report is an in-depth analysis detailing your home's value as well as a comparison with similar homes in the area
Home Values in the Area
Average Home Value in this Area
Purchase History
| Date | Buyer | Sale Price | Title Company |
|---|---|---|---|
| Chan Residence T | -- | None Available | |
| Huang Gui Zhen | -- | -- | |
| Chan Kang Kong | $240,000 | -- | |
| Bankamerica Natl T Co | $279,847 | -- | |
| Hiden Michael | $303,000 | -- |
Source: Public Records
Mortgage History
| Date | Status | Borrower | Loan Amount |
|---|---|---|---|
| Previous Owner | Hiden Michael | $125,000 | |
| Previous Owner | Hiden Michael | $207,000 | |
| Previous Owner | Hiden Michael | $192,000 |
Source: Public Records
Tax History Compared to Growth
Tax History
| Year | Tax Paid | Tax Assessment Tax Assessment Total Assessment is a certain percentage of the fair market value that is determined by local assessors to be the total taxable value of land and additions on the property. | Land | Improvement |
|---|---|---|---|---|
| 2025 | $11,036 | $1,126,100 | $735,400 | $390,700 |
| 2024 | $10,671 | $1,093,300 | $714,000 | $379,300 |
| 2023 | $10,170 | $999,000 | $573,500 | $425,500 |
| 2022 | $9,731 | $925,000 | $531,000 | $394,000 |
| 2021 | $9,131 | $848,600 | $487,200 | $361,400 |
| 2020 | $8,859 | $848,600 | $487,200 | $361,400 |
| 2019 | $8,288 | $793,100 | $455,300 | $337,800 |
| 2018 | $8,325 | $769,400 | $429,200 | $340,200 |
| 2017 | $7,850 | $705,900 | $393,800 | $312,100 |
| 2016 | $7,370 | $647,600 | $361,300 | $286,300 |
| 2015 | $7,026 | $605,200 | $337,700 | $267,500 |
Source: Public Records
Map
Nearby Homes
- 321 Albemarle Rd
- 53-55 N Gate Park
- 27 Cross St Unit 27
- 41 Kilburn Rd
- 4 Wiswall St
- 12 Wiswall St
- 43 Walker St
- 76 Harding St
- 354 Linwood Ave Unit 1
- 287 Cherry St Unit 2
- 97 North St
- 57 Walnut St
- 76 Taft Ave Unit 1
- 76 Taft Ave
- 76 Taft Ave Unit 2
- 75 Cherry St
- 611 Watertown St Unit 14
- 33 Joseph Rd
- 32-34 Rossmere St
- 123 Mount Vernon St Unit 2
- 81 Warwick Rd Unit 1
- 67 Warwick Rd
- 79 Warwick Rd Unit 81
- 59 Warwick Rd Unit 61
- 72 Warwick Rd Unit 74
- 83 Warwick Rd Unit 85
- 78 Warwick Rd Unit 2
- 78 Warwick Rd Unit 80
- 68 Warwick Rd Unit 68
- 68 Warwick Rd Unit 1
- 66 Warwick Rd Unit 68
- 80 Warwick Rd Unit 1
- 80 Warwick Rd Unit 80
- 80 Warwick Rd
- 88 Warwick Rd
- 88 Warwick Rd Unit 1
- 62 Warwick Rd Unit 1
- 62 Warwick Rd Unit 64
- 86 Warwick Rd Unit 88
- 86 Warwick Rd Unit 88