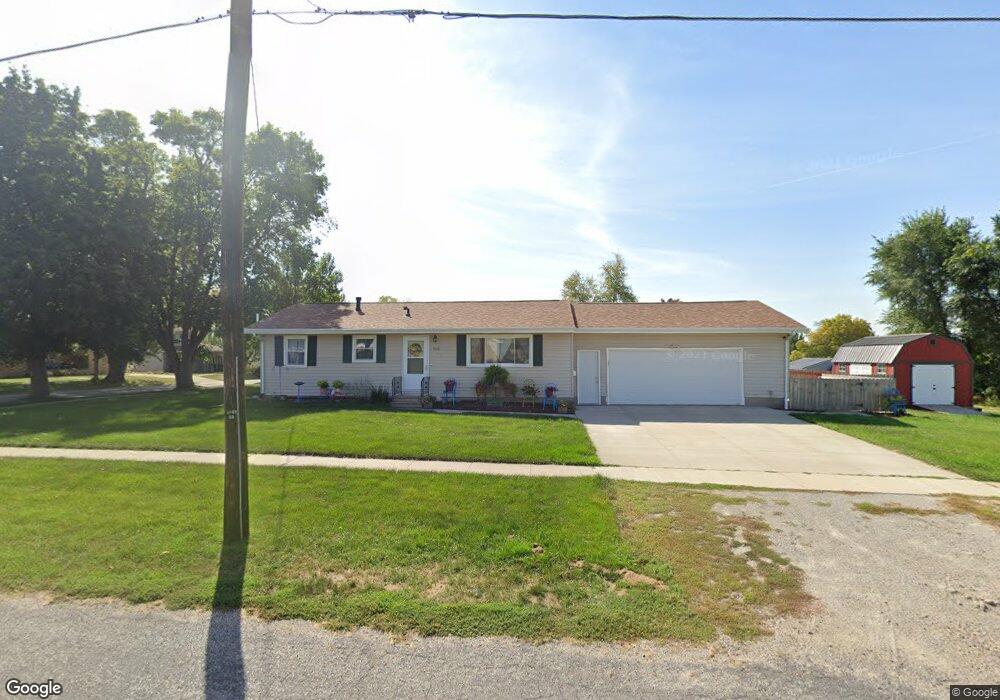
710 E 10th St Vinton, IA 52349
Estimated Value: $167,555 - $201,000
2
Beds
2
Baths
960
Sq Ft
$192/Sq Ft
Est. Value
About This Home
This home is located at 710 E 10th St, Vinton, IA 52349 and is currently estimated at $183,889, approximately $191 per square foot. 710 E 10th St is a home located in Benton County with nearby schools including Tilford Elementary School, Vinton-Shellsburg Middle School, and Vinton-Shellsburg High School.
Ownership History
Date
Name
Owned For
Owner Type
Purchase Details
Closed on
May 9, 2013
Sold by
Swallom Michael W and Swallom Sheri L
Bought by
Hazen Casey T and Hazen Jill M
Current Estimated Value
Home Financials for this Owner
Home Financials are based on the most recent Mortgage that was taken out on this home.
Original Mortgage
$114,650
Outstanding Balance
$81,533
Interest Rate
3.56%
Mortgage Type
VA
Estimated Equity
$102,356
Create a Home Valuation Report for This Property
The Home Valuation Report is an in-depth analysis detailing your home's value as well as a comparison with similar homes in the area
Home Values in the Area
Average Home Value in this Area
Purchase History
| Date | Buyer | Sale Price | Title Company |
|---|---|---|---|
| Hazen Casey T | $112,000 | None Available |
Source: Public Records
Mortgage History
| Date | Status | Borrower | Loan Amount |
|---|---|---|---|
| Open | Hazen Casey T | $114,650 |
Source: Public Records
Tax History
| Year | Tax Paid | Tax Assessment Tax Assessment Total Assessment is a certain percentage of the fair market value that is determined by local assessors to be the total taxable value of land and additions on the property. | Land | Improvement |
|---|---|---|---|---|
| 2025 | $2,394 | $162,300 | $16,500 | $145,800 |
| 2024 | $2,394 | $146,400 | $16,500 | $129,900 |
| 2023 | $2,286 | $146,400 | $16,500 | $129,900 |
| 2022 | $2,344 | $118,500 | $13,200 | $105,300 |
| 2021 | $2,344 | $118,500 | $13,200 | $105,300 |
| 2020 | $2,114 | $109,900 | $12,500 | $97,400 |
| 2019 | $2,114 | $109,900 | $12,500 | $97,400 |
| 2018 | $2,048 | $108,200 | $12,000 | $96,200 |
| 2017 | $2,048 | $108,200 | $12,000 | $96,200 |
| 2016 | $1,922 | $101,100 | $11,200 | $89,900 |
| 2015 | $1,922 | $101,100 | $11,200 | $89,900 |
| 2014 | $1,990 | $93,100 | $0 | $0 |
Source: Public Records
Map
Nearby Homes
Your Personal Tour Guide
Ask me questions while you tour the home.