
Seller's Agent in 2025
Lauren Mueggenborg
The Agency
(918) 691-6005
62 Total Sales
Estimated Value: $79,508 - $122,000
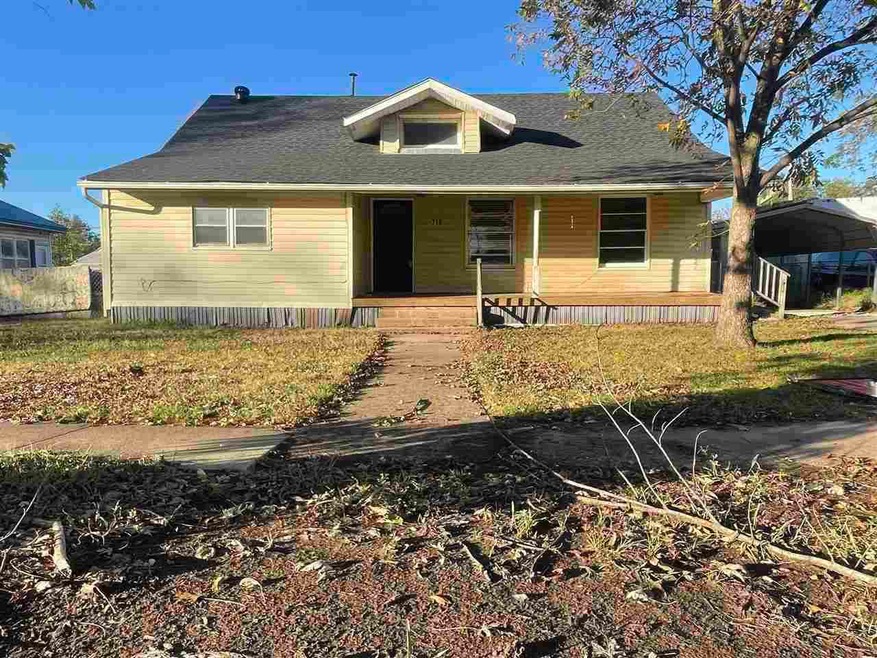
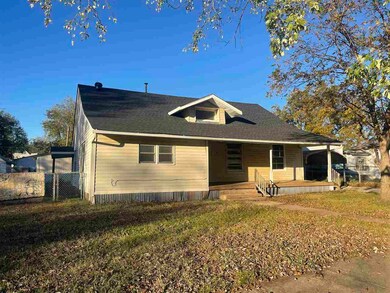
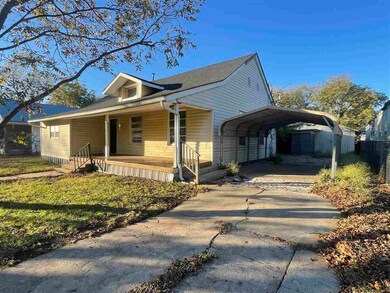
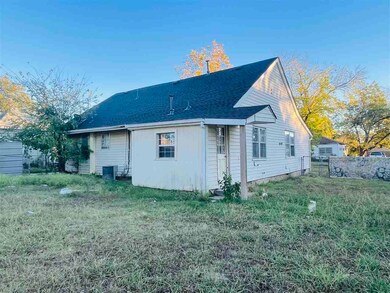
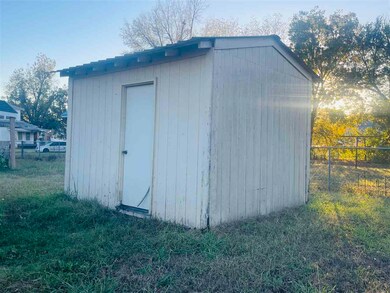
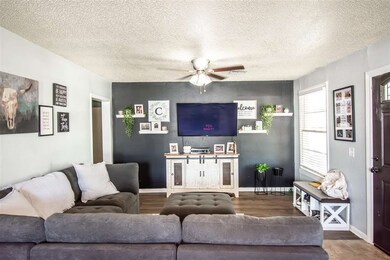
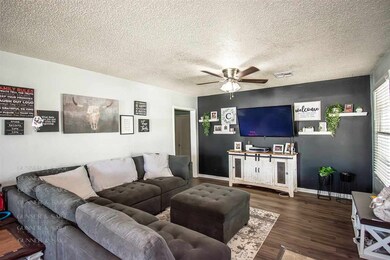
MAKE AN OFFER! Looking for your first starter home to make your own? Look no further. What more could you ask for when ALL of the hard work has been done for you. The roof is only a year old. Spacious living and bedrooms. This property also has a detached garage, carport, and a large outbuilding for extra storage! This fabulous investment property has no trouble staying occupied at $750 a month. It’s a no brainer. Call NOW to add this gem to your rental inventory or to begin your journey of homeownership! Start the new year off as a homeowner.
| Date | Buyer | Sale Price | Title Company |
|---|---|---|---|
| Pritchett Tyler | $105,000 | Octs | |
| Pritchett Tyler | $105,000 | Octs |
| Date | Status | Borrower | Loan Amount |
|---|---|---|---|
| Open | Pritchett Tyler | $103,098 | |
| Closed | Pritchett Tyler | $103,098 |
| Date | Event | Price | List to Sale | Price per Sq Ft |
|---|---|---|---|---|
| 02/25/2025 02/25/25 | Sold | $105,000 | 0.0% | $79 / Sq Ft |
| 11/15/2024 11/15/24 | Price Changed | $105,000 | -5.8% | $79 / Sq Ft |
| 09/29/2024 09/29/24 | Price Changed | $111,500 | -3.0% | $84 / Sq Ft |
| 09/05/2024 09/05/24 | For Sale | $115,000 | -- | $86 / Sq Ft |
| Year | Tax Paid | Tax Assessment Tax Assessment Total Assessment is a certain percentage of the fair market value that is determined by local assessors to be the total taxable value of land and additions on the property. | Land | Improvement |
|---|---|---|---|---|
| 2025 | $558 | $5,992 | $387 | $5,605 |
| 2024 | $558 | $5,992 | $387 | $5,605 |
| 2023 | $508 | $5,707 | $502 | $5,205 |
| 2022 | $463 | $5,435 | $568 | $4,867 |
| 2021 | $430 | $5,176 | $570 | $4,606 |
| 2020 | $610 | $7,449 | $570 | $6,879 |
| 2019 | $352 | $5,107 | $570 | $4,537 |
| 2018 | $151 | $5,107 | $570 | $4,537 |
| 2017 | $338 | $5,107 | $570 | $4,537 |
| 2016 | $154 | $5,107 | $570 | $4,537 |
| 2015 | $163 | $2,879 | $431 | $2,448 |
| 2014 | $162 | $2,879 | $431 | $2,448 |
Seller's Agent in 2025
Lauren Mueggenborg
The Agency
(918) 691-6005
62 Total Sales
Source: Stillwater Board of REALTORS®
MLS Number: 130548
APN: 600001443
Disclaimer: Certain information contained herein is derived from information provided by parties other than Homes.com. All information provided is deemed reliable, but is not guaranteed to be accurate and should be independently verified.
![]() IDX information is provided exclusively for personal, non-commercial use, and may not be used for any purpose other than to identify prospective properties consumers may be interested in purchasing. Information is deemed reliable but not guaranteed.
IDX information is provided exclusively for personal, non-commercial use, and may not be used for any purpose other than to identify prospective properties consumers may be interested in purchasing. Information is deemed reliable but not guaranteed.
Ask me questions while you tour the home.