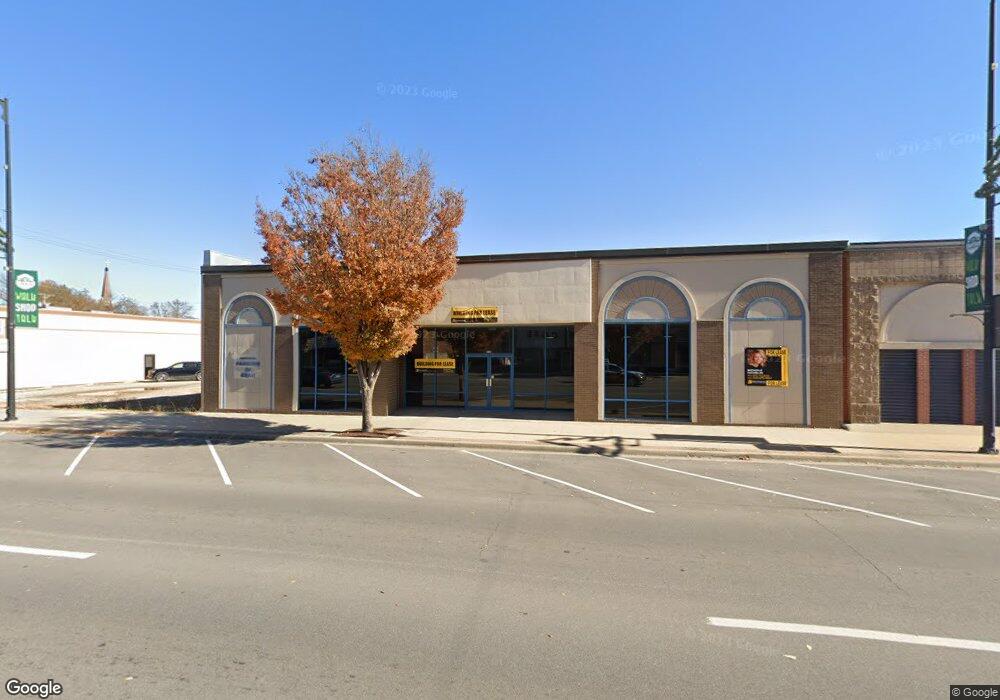
710 N Broadway Pittsburg, KS 66762
Estimated Value: $511,330
--
Bed
--
Bath
9,000
Sq Ft
$57/Sq Ft
Est. Value
About This Home
This home is located at 710 N Broadway, Pittsburg, KS 66762 and is currently estimated at $511,330, approximately $56 per square foot. 710 N Broadway is a home located in Crawford County with nearby schools including Westside Elementary School, Pittsburg Middle School, and Pittsburg High School.
Ownership History
Date
Name
Owned For
Owner Type
Purchase Details
Closed on
Jan 25, 2024
Sold by
Do John D
Bought by
Together Families
Current Estimated Value
Home Financials for this Owner
Home Financials are based on the most recent Mortgage that was taken out on this home.
Original Mortgage
$861,000
Outstanding Balance
$819,692
Interest Rate
0.66%
Mortgage Type
Construction
Estimated Equity
-$308,362
Purchase Details
Closed on
Feb 18, 2022
Bought by
Do John and Nguyen Ngan
Purchase Details
Closed on
Sep 1, 2001
Bought by
Fleske John A and Fleske Suezette M
Create a Home Valuation Report for This Property
The Home Valuation Report is an in-depth analysis detailing your home's value as well as a comparison with similar homes in the area
Home Values in the Area
Average Home Value in this Area
Purchase History
| Date | Buyer | Sale Price | Title Company |
|---|---|---|---|
| Together Families | $1,076,250 | Crawford Cnty Abstract Co Inc | |
| Do John | $411,500 | -- | |
| Fleske John A | $45,000 | -- |
Source: Public Records
Mortgage History
| Date | Status | Borrower | Loan Amount |
|---|---|---|---|
| Open | Together Families | $861,000 |
Source: Public Records
Tax History Compared to Growth
Tax History
| Year | Tax Paid | Tax Assessment Tax Assessment Total Assessment is a certain percentage of the fair market value that is determined by local assessors to be the total taxable value of land and additions on the property. | Land | Improvement |
|---|---|---|---|---|
| 2025 | $19,601 | $0 | $0 | $0 |
| 2024 | $19,601 | $127,411 | $10,238 | $117,173 |
| 2023 | $15,239 | $99,370 | $10,100 | $89,270 |
| 2022 | $14,909 | $95,680 | $13,095 | $82,585 |
| 2021 | $14,971 | $95,525 | $10,475 | $85,050 |
| 2020 | $14,559 | $92,861 | $7,078 | $85,783 |
| 2019 | $14,528 | $92,861 | $7,078 | $85,783 |
| 2018 | $14,114 | $90,726 | $7,078 | $83,648 |
| 2017 | $14,087 | $90,726 | $7,078 | $83,648 |
| 2016 | $14,003 | $90,726 | $7,078 | $83,648 |
| 2015 | $13,730 | $90,726 | $7,013 | $83,713 |
| 2014 | $13,730 | $90,726 | $7,013 | $83,713 |
Source: Public Records
Map
Nearby Homes