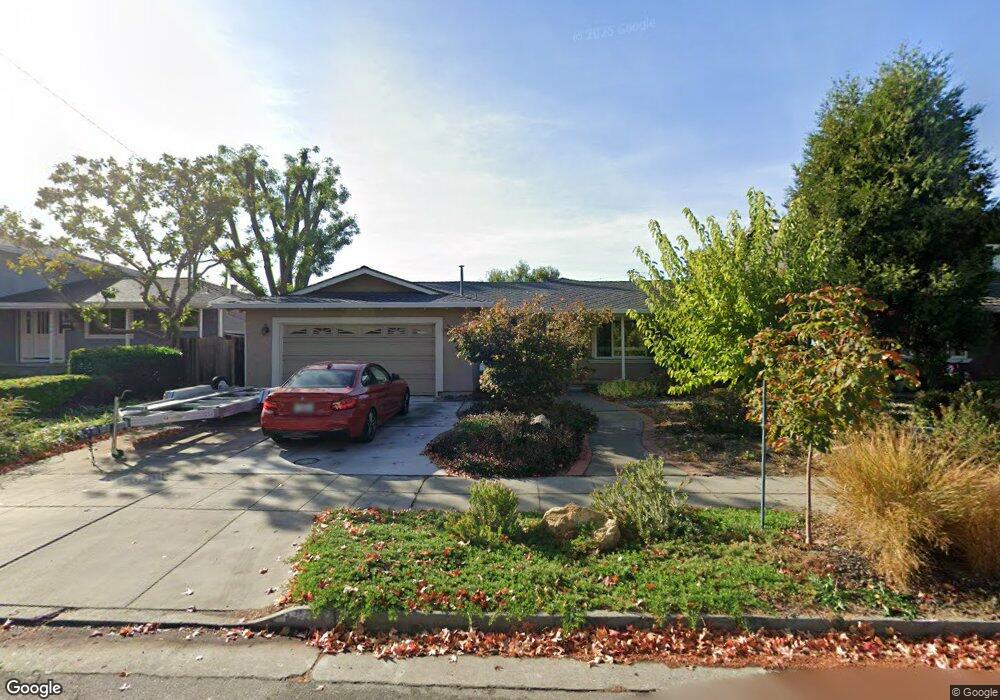
710 Natoma Dr San Jose, CA 95123
Canoas NeighborhoodEstimated Value: $1,344,000 - $1,575,000
3
Beds
2
Baths
1,347
Sq Ft
$1,104/Sq Ft
Est. Value
About This Home
This home is located at 710 Natoma Dr, San Jose, CA 95123 and is currently estimated at $1,486,742, approximately $1,103 per square foot. 710 Natoma Dr is a home located in Santa Clara County with nearby schools including Allen at Steinbeck, Castillero Middle School, and Gunderson High School.
Ownership History
Date
Name
Owned For
Owner Type
Purchase Details
Closed on
Jun 12, 2019
Sold by
Koradi Xiaoxiao and Koradi Reto
Bought by
Koradi Reto
Current Estimated Value
Home Financials for this Owner
Home Financials are based on the most recent Mortgage that was taken out on this home.
Original Mortgage
$447,850
Outstanding Balance
$293,844
Interest Rate
4.1%
Mortgage Type
New Conventional
Estimated Equity
$1,192,898
Purchase Details
Closed on
Aug 1, 2007
Sold by
Crew Catherine D
Bought by
Koradi Reto
Home Financials for this Owner
Home Financials are based on the most recent Mortgage that was taken out on this home.
Original Mortgage
$71,500
Interest Rate
6.62%
Mortgage Type
Stand Alone Second
Purchase Details
Closed on
May 17, 2005
Sold by
Crew Catherine D and Crew Kate
Bought by
Crew Catherine D
Purchase Details
Closed on
Jan 18, 2005
Sold by
Crew Catherine D and Crew Kate
Bought by
Crew Catherine D
Home Financials for this Owner
Home Financials are based on the most recent Mortgage that was taken out on this home.
Original Mortgage
$100,000
Interest Rate
5.69%
Mortgage Type
Credit Line Revolving
Purchase Details
Closed on
Nov 22, 2002
Sold by
Crew Kate
Bought by
Crew Kate
Home Financials for this Owner
Home Financials are based on the most recent Mortgage that was taken out on this home.
Original Mortgage
$367,500
Interest Rate
5.25%
Mortgage Type
Purchase Money Mortgage
Purchase Details
Closed on
Sep 15, 2001
Sold by
Crew Timothy N
Bought by
Crew Kate
Purchase Details
Closed on
Apr 7, 1999
Sold by
Crew Catherine D
Bought by
Crew Timothy and Crew Catherine D
Home Financials for this Owner
Home Financials are based on the most recent Mortgage that was taken out on this home.
Original Mortgage
$240,000
Interest Rate
7.04%
Purchase Details
Closed on
Jan 6, 1995
Sold by
Crew Tim
Bought by
Crew Catherine D
Home Financials for this Owner
Home Financials are based on the most recent Mortgage that was taken out on this home.
Original Mortgage
$175,750
Interest Rate
9.29%
Purchase Details
Closed on
Jan 5, 1995
Sold by
Winthrop Pensions & Insurance Inc and Brandel Milroy
Bought by
Crew Catherine D
Home Financials for this Owner
Home Financials are based on the most recent Mortgage that was taken out on this home.
Original Mortgage
$175,750
Interest Rate
9.29%
Purchase Details
Closed on
Apr 13, 1994
Sold by
Savings Mtg Corp
Bought by
Winthrop Pensions & Insurance Inc and Brandel Milroy
Create a Home Valuation Report for This Property
The Home Valuation Report is an in-depth analysis detailing your home's value as well as a comparison with similar homes in the area
Home Values in the Area
Average Home Value in this Area
Purchase History
| Date | Buyer | Sale Price | Title Company |
|---|---|---|---|
| Koradi Reto | -- | Wfg Lender Services | |
| Koradi Reto | $715,000 | Chicago Title Company | |
| Crew Catherine D | -- | -- | |
| Crew Catherine D | -- | Chicago Title | |
| Crew Kate | -- | Fidelity National Title Co | |
| Crew Kate | -- | -- | |
| Crew Timothy | -- | Fidelity National Title Co | |
| Crew Catherine D | -- | -- | |
| Crew Catherine D | -- | First American Title Guarant | |
| Crew Catherine D | $185,000 | First American Title Guarant | |
| Winthrop Pensions & Insurance Inc | $75,483 | Fidelity Natl Title Co |
Source: Public Records
Mortgage History
| Date | Status | Borrower | Loan Amount |
|---|---|---|---|
| Open | Koradi Reto | $447,850 | |
| Closed | Koradi Reto | $71,500 | |
| Closed | Koradi Reto | $572,000 | |
| Previous Owner | Crew Catherine D | $100,000 | |
| Previous Owner | Crew Kate | $367,500 | |
| Previous Owner | Crew Timothy | $240,000 | |
| Previous Owner | Crew Catherine D | $175,750 |
Source: Public Records
Tax History Compared to Growth
Tax History
| Year | Tax Paid | Tax Assessment Tax Assessment Total Assessment is a certain percentage of the fair market value that is determined by local assessors to be the total taxable value of land and additions on the property. | Land | Improvement |
|---|---|---|---|---|
| 2025 | $12,072 | $939,150 | $657,407 | $281,743 |
| 2024 | $12,072 | $920,736 | $644,517 | $276,219 |
| 2023 | $12,072 | $902,683 | $631,880 | $270,803 |
| 2022 | $11,737 | $884,985 | $619,491 | $265,494 |
| 2021 | $11,493 | $867,634 | $607,345 | $260,289 |
| 2020 | $11,231 | $858,739 | $601,118 | $257,621 |
| 2019 | $10,990 | $841,902 | $589,332 | $252,570 |
| 2018 | $10,880 | $825,395 | $577,777 | $247,618 |
| 2017 | $10,791 | $809,212 | $566,449 | $242,763 |
| 2016 | $10,025 | $745,700 | $521,200 | $224,500 |
| 2015 | $9,828 | $724,000 | $506,800 | $217,200 |
| 2014 | $7,796 | $583,000 | $408,100 | $174,900 |
Source: Public Records
Map
Nearby Homes
- 5850 Chesbro Ave
- 5986 Loma Prieta Dr
- 729 Calero Ave
- 5841 Blossom Ave
- 5697 Chesbro Ave
- 5806 Blossom Ave
- 5749 San Lorenzo Dr
- 783 Vereda Ct
- 5660 Calmor Ave Unit 4
- 5629 Morton Way
- 5756 Pontiac Dr
- 734 Pronto Dr
- 5707 Calmor Ave Unit 3
- 5870 Cabral Ave
- 731 Los Huecos Dr
- 5683 Playa Del Rey Unit 1
- 521 Canton Dr
- 5629 Playa Del Rey Ct Unit 3
- 5571 Sunny Oaks Dr
- 775 Sunset Glen Dr