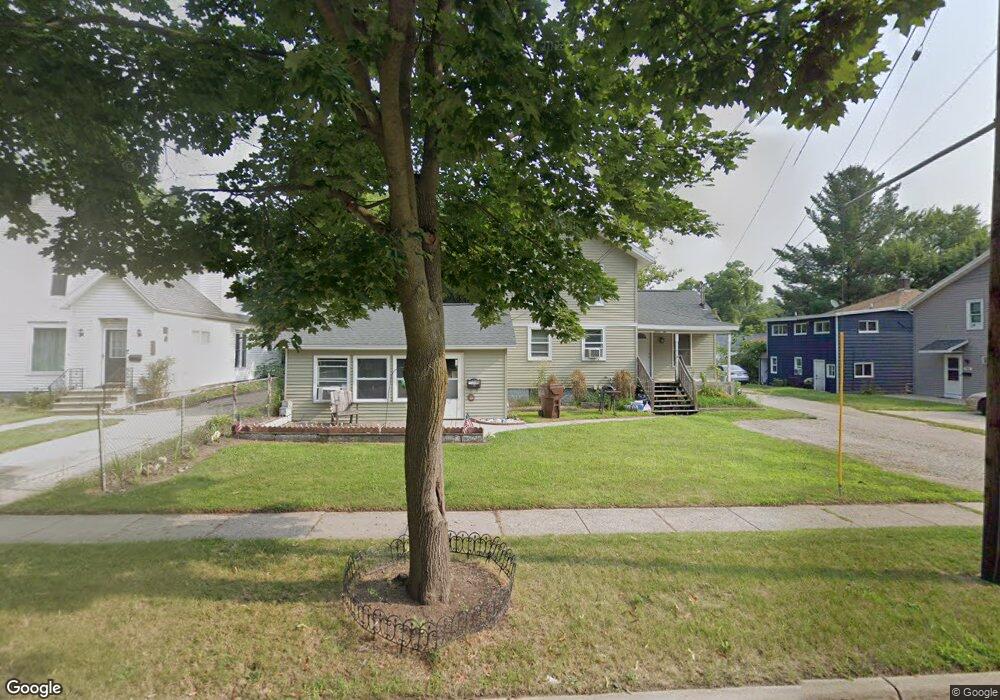
710 W Jefferson St Grand Ledge, MI 48837
Estimated Value: $231,103 - $280,000
5
Beds
3
Baths
2,138
Sq Ft
$121/Sq Ft
Est. Value
About This Home
This home is located at 710 W Jefferson St, Grand Ledge, MI 48837 and is currently estimated at $258,026, approximately $120 per square foot. 710 W Jefferson St is a home located in Eaton County with nearby schools including Beagle Middle School, Leon W. Hayes Middle School, and Grand Ledge High School.
Ownership History
Date
Name
Owned For
Owner Type
Purchase Details
Closed on
Nov 7, 2022
Sold by
Hall
Bought by
Tpe 1 Llc
Current Estimated Value
Purchase Details
Closed on
Mar 27, 2013
Sold by
Federal National Mortgage Association
Bought by
Hall David M
Home Financials for this Owner
Home Financials are based on the most recent Mortgage that was taken out on this home.
Original Mortgage
$33,120
Interest Rate
3.52%
Mortgage Type
New Conventional
Purchase Details
Closed on
Aug 23, 2012
Sold by
Smith Roy C and Smith Mary N
Bought by
Federal National Mortgage Association
Purchase Details
Closed on
Feb 13, 2003
Sold by
Hoffman Michael R and Hoffman Charlene L
Bought by
Smith Harold L and Smith Roy C
Home Financials for this Owner
Home Financials are based on the most recent Mortgage that was taken out on this home.
Original Mortgage
$98,000
Interest Rate
6%
Purchase Details
Closed on
Dec 18, 2002
Sold by
Parsons Susan E
Bought by
Hoffman Michael F and Hoffman Charlene L
Home Financials for this Owner
Home Financials are based on the most recent Mortgage that was taken out on this home.
Original Mortgage
$98,000
Interest Rate
6%
Create a Home Valuation Report for This Property
The Home Valuation Report is an in-depth analysis detailing your home's value as well as a comparison with similar homes in the area
Home Values in the Area
Average Home Value in this Area
Purchase History
| Date | Buyer | Sale Price | Title Company |
|---|---|---|---|
| Tpe 1 Llc | -- | Liberty Title | |
| Hall David M | $36,880 | None Available | |
| Federal National Mortgage Association | $98,008 | None Available | |
| Smith Harold L | $75,000 | -- | |
| Smith Roy C | -- | -- | |
| Hoffman Michael F | $72,000 | -- |
Source: Public Records
Mortgage History
| Date | Status | Borrower | Loan Amount |
|---|---|---|---|
| Previous Owner | Hall David M | $33,120 | |
| Previous Owner | Smith Roy C | $98,000 |
Source: Public Records
Tax History Compared to Growth
Tax History
| Year | Tax Paid | Tax Assessment Tax Assessment Total Assessment is a certain percentage of the fair market value that is determined by local assessors to be the total taxable value of land and additions on the property. | Land | Improvement |
|---|---|---|---|---|
| 2025 | $4,016 | $82,500 | $0 | $0 |
| 2024 | $3,039 | $75,900 | $0 | $0 |
| 2023 | $2,868 | $74,000 | $0 | $0 |
| 2022 | $4,029 | $66,800 | $0 | $0 |
| 2021 | $3,450 | $60,100 | $0 | $0 |
| 2020 | $3,405 | $57,300 | $0 | $0 |
| 2019 | $3,524 | $54,002 | $0 | $0 |
| 2018 | $3,157 | $52,100 | $0 | $0 |
| 2017 | $3,036 | $52,900 | $0 | $0 |
| 2016 | $2,455 | $51,700 | $0 | $0 |
| 2015 | -- | $49,000 | $0 | $0 |
| 2014 | -- | $47,800 | $0 | $0 |
| 2013 | -- | $47,800 | $0 | $0 |
Source: Public Records
Map
Nearby Homes
- 521 Pleasant St
- 0 W Jefferson St
- 855 W Jefferson St Unit 38
- 855 W Jefferson St Unit 44F
- 855 W Jefferson St Unit 12C
- 855 W Jefferson St Unit 24
- 855 W Jefferson St Unit 29
- 855 W Jefferson St Unit 26
- 855 W Jefferson St Unit 25
- 855 W Jefferson St Unit 1
- 855 W Jefferson St Unit 170
- 225 W Scott St
- 12770 Partlow Ave
- 702 W Main St
- 1000 Hawks Ridge
- 322 W Front St
- 209 Mineral St
- 1204 Burlington Dr
- 218 Russell St
- 903 Timber Creek Dr Unit 136
- 716 W Jefferson St
- 700 W Jefferson St
- 134 Perry St
- 130 Perry St
- 709 W Jefferson St
- 701 W Jefferson St
- 713 W Jefferson St
- 701 E Jefferson St
- 726 W Jefferson St
- 726 W Jefferson St Unit 8
- 715 W Jefferson St
- V/L W Lansing Rd
- 732 W Jefferson St
- 641 W Jefferson St
- 723 W Jefferson St
- 630 W Jefferson St
- 116 Perry St
- 736 W Jefferson St
- 631 W Jefferson St