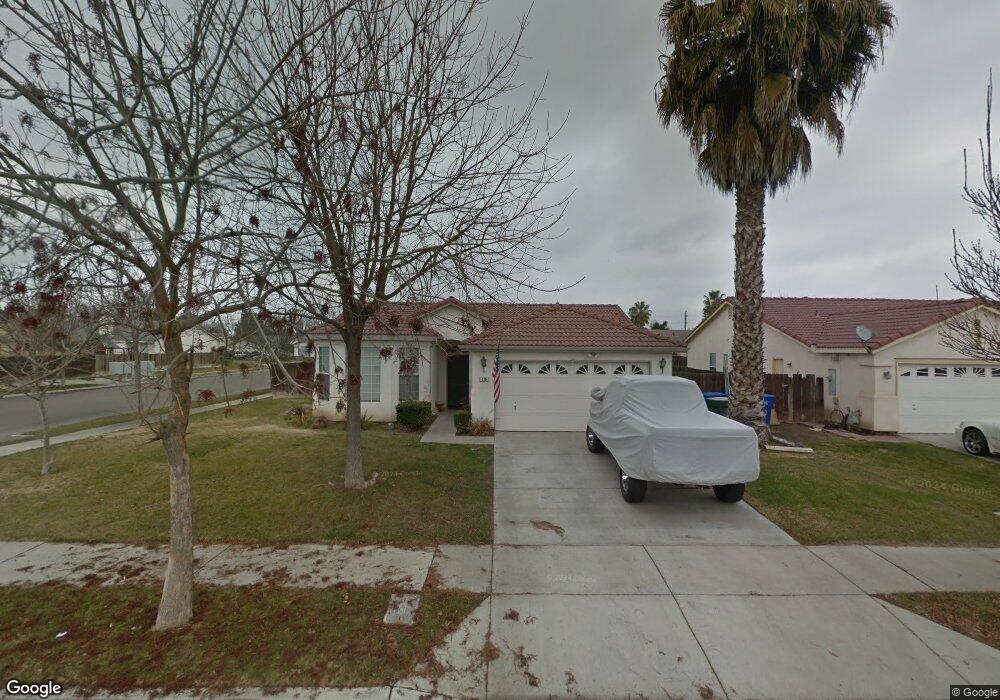
710 Wexford Ct Lemoore, CA 93245
Estimated Value: $312,501 - $351,000
3
Beds
2
Baths
1,341
Sq Ft
$245/Sq Ft
Est. Value
About This Home
This home is located at 710 Wexford Ct, Lemoore, CA 93245 and is currently estimated at $328,375, approximately $244 per square foot. 710 Wexford Ct is a home located in Kings County with nearby schools including Cinnamon Elementary School, Liberty Middle School, and Lemoore High School.
Ownership History
Date
Name
Owned For
Owner Type
Purchase Details
Closed on
Jul 11, 2016
Sold by
Lasalle Timothy J and Lasalle Judelon G
Bought by
Lasalle Timothy J and Lasalle Judelon G
Current Estimated Value
Purchase Details
Closed on
Apr 5, 2005
Sold by
Lasalle Timothy J and Lasalle Judelon G
Bought by
Lasalle Timothy J and Lasalle Judelon G
Home Financials for this Owner
Home Financials are based on the most recent Mortgage that was taken out on this home.
Original Mortgage
$113,000
Interest Rate
5.77%
Mortgage Type
New Conventional
Purchase Details
Closed on
Nov 6, 2001
Sold by
Lasalle Timothy J and Lasalle Judelon G
Bought by
Lasalle Timothy J and Lasalle Judelon G
Purchase Details
Closed on
Jun 14, 1999
Sold by
Mercado David and Mercado Nancy
Bought by
Lasalle Timothy J and Lasalle Judelon
Home Financials for this Owner
Home Financials are based on the most recent Mortgage that was taken out on this home.
Original Mortgage
$56,000
Interest Rate
7.64%
Create a Home Valuation Report for This Property
The Home Valuation Report is an in-depth analysis detailing your home's value as well as a comparison with similar homes in the area
Home Values in the Area
Average Home Value in this Area
Purchase History
| Date | Buyer | Sale Price | Title Company |
|---|---|---|---|
| Lasalle Timothy J | -- | None Available | |
| Lasalle Timothy J | -- | None Available | |
| Lasalle Timothy J | -- | North American Title Company | |
| Lasalle Timothy J | -- | North American Title Company | |
| Lasalle Timothy J | -- | -- | |
| Lasalle Timothy J | -- | -- | |
| Lasalle Timothy J | $102,000 | Chicago Title Co |
Source: Public Records
Mortgage History
| Date | Status | Borrower | Loan Amount |
|---|---|---|---|
| Previous Owner | Lasalle Timothy J | $113,000 | |
| Previous Owner | Lasalle Timothy J | $56,000 |
Source: Public Records
Tax History
| Year | Tax Paid | Tax Assessment Tax Assessment Total Assessment is a certain percentage of the fair market value that is determined by local assessors to be the total taxable value of land and additions on the property. | Land | Improvement |
|---|---|---|---|---|
| 2025 | $1,725 | $156,774 | $46,111 | $110,663 |
| 2023 | $1,725 | $150,688 | $44,321 | $106,367 |
| 2022 | $1,804 | $147,734 | $43,452 | $104,282 |
| 2021 | $1,762 | $144,838 | $42,600 | $102,238 |
| 2020 | $1,753 | $143,353 | $42,163 | $101,190 |
| 2019 | $1,741 | $140,542 | $41,336 | $99,206 |
| 2018 | $1,644 | $137,786 | $40,525 | $97,261 |
| 2017 | $1,647 | $135,084 | $39,730 | $95,354 |
| 2016 | $1,557 | $132,435 | $38,951 | $93,484 |
| 2015 | $1,551 | $130,446 | $38,366 | $92,080 |
| 2014 | $1,510 | $127,890 | $37,614 | $90,276 |
Source: Public Records
Map
Nearby Homes
- 698 Wexford Ct
- 687 Woodridge Ct
- 1005 Jubilee Ct
- 809 Wildwood Dr
- 865 Avalon Dr
- 342 G Aly Units X&y
- 334 G St Unit X
- 1116 Liberation Way
- 701 Strada St
- 756 Strada St
- 952 Scotland St
- 1150 Fire Fall Ave
- 636 Castellina St
- 730 W D St
- 870 Cypress Ct
- 164 Cantebury Dr
- 231 E St
- 555 W D St
- 746 Pepper Ave
- 73 Devon Dr
- 711 Bristol Ct
- 699 Bristol Ct
- 802 Wexford Dr
- 686 Wexford Ct
- 711 Wexford Ct
- 687 Bristol Ct
- 699 Wexford Ct
- 801 Bristol Cir
- 723 Wexford Ct
- 814 Wexford Dr
- 674 Wexford Ct
- 687 Wexford Ct
- 813 Bristol Cir
- 735 Wexford Ct
- 675 Bristol Ct
- 675 Wexford Ct
- 802 Bristol Cir
- 826 Wexford Dr
- 662 Wexford Ct
- 663 Wexford Ct
Your Personal Tour Guide
Ask me questions while you tour the home.