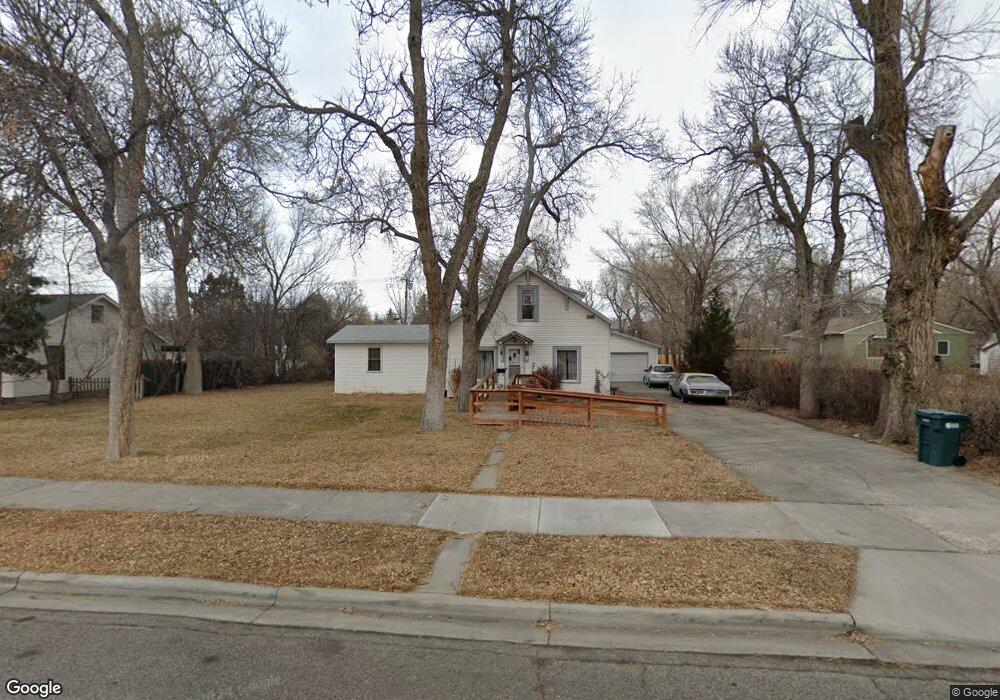
711 Cook Ave Billings, MT 59101
East Central Billings NeighborhoodEstimated Value: $301,000 - $334,000
3
Beds
3
Baths
2,312
Sq Ft
$138/Sq Ft
Est. Value
About This Home
This home is located at 711 Cook Ave, Billings, MT 59101 and is currently estimated at $319,897, approximately $138 per square foot. 711 Cook Ave is a home located in Yellowstone County with nearby schools including Washington School, Lewis & Clark Junior High School, and Billings Senior High School.
Ownership History
Date
Name
Owned For
Owner Type
Purchase Details
Closed on
Nov 29, 2022
Sold by
Sherman Joseph and Sherman Harry
Bought by
Halland Alicia R
Current Estimated Value
Home Financials for this Owner
Home Financials are based on the most recent Mortgage that was taken out on this home.
Original Mortgage
$216,727
Outstanding Balance
$208,297
Interest Rate
5.5%
Mortgage Type
FHA
Estimated Equity
$103,625
Purchase Details
Closed on
Mar 23, 2011
Sold by
Reighard Melody and Sherman Melody
Bought by
Sherman Judy
Purchase Details
Closed on
Jun 28, 2006
Sold by
Sherman Marie and Sherman Marie Helen
Bought by
Sherman Judy
Create a Home Valuation Report for This Property
The Home Valuation Report is an in-depth analysis detailing your home's value as well as a comparison with similar homes in the area
Home Values in the Area
Average Home Value in this Area
Purchase History
| Date | Buyer | Sale Price | Title Company |
|---|---|---|---|
| Halland Alicia R | -- | Chicago Title | |
| Sherman Judy | -- | None Available | |
| Sherman Judy | -- | None Available |
Source: Public Records
Mortgage History
| Date | Status | Borrower | Loan Amount |
|---|---|---|---|
| Open | Halland Alicia R | $216,727 |
Source: Public Records
Tax History Compared to Growth
Tax History
| Year | Tax Paid | Tax Assessment Tax Assessment Total Assessment is a certain percentage of the fair market value that is determined by local assessors to be the total taxable value of land and additions on the property. | Land | Improvement |
|---|---|---|---|---|
| 2025 | $2,883 | $278,600 | $45,411 | $233,189 |
| 2024 | $2,883 | $274,800 | $43,747 | $231,053 |
| 2023 | $2,917 | $274,800 | $43,747 | $231,053 |
| 2022 | $1,839 | $194,800 | $0 | $0 |
| 2021 | $2,285 | $194,800 | $0 | $0 |
| 2020 | $2,455 | $195,700 | $0 | $0 |
| 2019 | $2,346 | $195,700 | $0 | $0 |
| 2018 | $2,183 | $174,700 | $0 | $0 |
| 2017 | $1,618 | $174,700 | $0 | $0 |
| 2016 | $2,000 | $163,000 | $0 | $0 |
| 2015 | $1,949 | $163,000 | $0 | $0 |
| 2014 | $1,684 | $72,504 | $0 | $0 |
Source: Public Records
Map
Nearby Homes