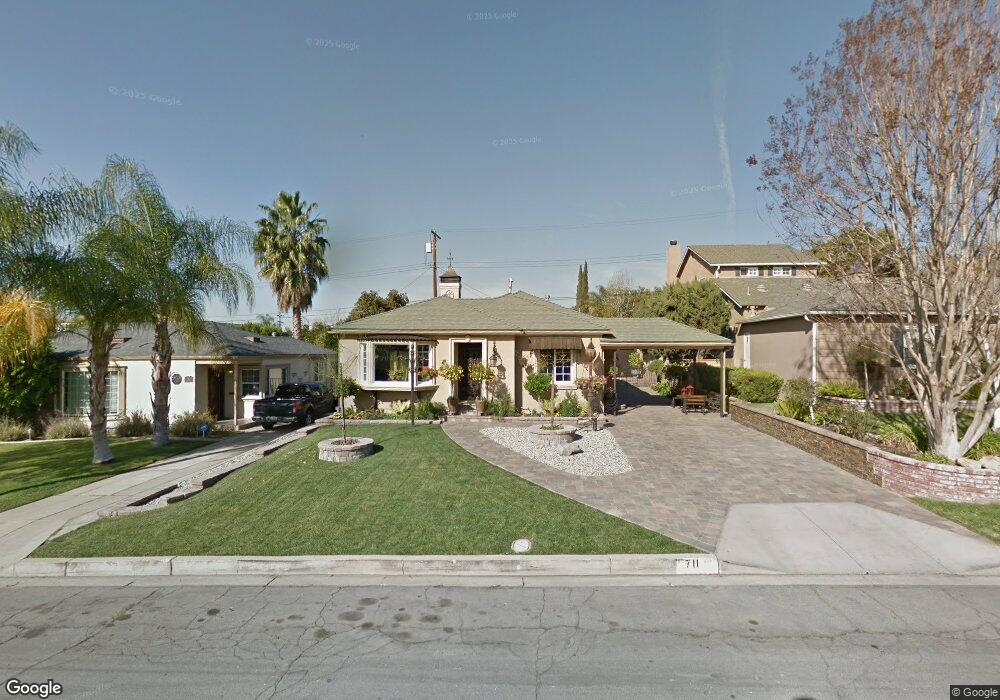
711 E Valencia Ave Burbank, CA 91501
Hillside District NeighborhoodEstimated Value: $1,106,155 - $1,679,000
2
Beds
2
Baths
1,347
Sq Ft
$980/Sq Ft
Est. Value
About This Home
This home is located at 711 E Valencia Ave, Burbank, CA 91501 and is currently estimated at $1,319,789, approximately $979 per square foot. 711 E Valencia Ave is a home located in Los Angeles County with nearby schools including Joaquin Miller Elementary School, John Muir Middle School, and Burbank High School.
Ownership History
Date
Name
Owned For
Owner Type
Purchase Details
Closed on
Aug 4, 2017
Sold by
Dersarkissian Vahak
Bought by
Dersarkissian Vahak and Megerdichian Hranoush
Current Estimated Value
Purchase Details
Closed on
Sep 5, 2002
Sold by
Sarkissian Vahak Der
Bought by
Sarkissian Vahak Der and Megerdichian Hranoush
Home Financials for this Owner
Home Financials are based on the most recent Mortgage that was taken out on this home.
Original Mortgage
$227,000
Interest Rate
6.37%
Purchase Details
Closed on
Jan 5, 1999
Sold by
Trainor Linda L Tr Trainor Trust
Bought by
Dersarkissian Vahak
Home Financials for this Owner
Home Financials are based on the most recent Mortgage that was taken out on this home.
Original Mortgage
$224,000
Interest Rate
6.63%
Purchase Details
Closed on
Dec 24, 1998
Sold by
Megardichian Hrandosh
Bought by
Dersarkissian Vahak
Home Financials for this Owner
Home Financials are based on the most recent Mortgage that was taken out on this home.
Original Mortgage
$224,000
Interest Rate
6.63%
Create a Home Valuation Report for This Property
The Home Valuation Report is an in-depth analysis detailing your home's value as well as a comparison with similar homes in the area
Home Values in the Area
Average Home Value in this Area
Purchase History
| Date | Buyer | Sale Price | Title Company |
|---|---|---|---|
| Dersarkissian Vahak | -- | None Available | |
| Sarkissian Vahak Der | -- | Gateway Title Company | |
| Dersarkissian Vahak | $250,000 | Southland Title Corporation | |
| Dersarkissian Vahak | -- | Southland Title Corporation |
Source: Public Records
Mortgage History
| Date | Status | Borrower | Loan Amount |
|---|---|---|---|
| Closed | Sarkissian Vahak Der | $227,000 | |
| Closed | Dersarkissian Vahak | $224,000 |
Source: Public Records
Tax History Compared to Growth
Tax History
| Year | Tax Paid | Tax Assessment Tax Assessment Total Assessment is a certain percentage of the fair market value that is determined by local assessors to be the total taxable value of land and additions on the property. | Land | Improvement |
|---|---|---|---|---|
| 2025 | $4,617 | $408,208 | $235,144 | $173,064 |
| 2024 | $4,617 | $400,205 | $230,534 | $169,671 |
| 2023 | $4,569 | $392,359 | $226,014 | $166,345 |
| 2022 | $4,364 | $384,667 | $221,583 | $163,084 |
| 2021 | $4,343 | $377,126 | $217,239 | $159,887 |
| 2019 | $4,170 | $365,943 | $210,797 | $155,146 |
| 2018 | $4,082 | $358,768 | $206,664 | $152,104 |
| 2016 | $3,869 | $344,839 | $198,640 | $146,199 |
| 2015 | $3,791 | $339,660 | $195,657 | $144,003 |
| 2014 | $3,786 | $333,008 | $191,825 | $141,183 |
Source: Public Records
Map
Nearby Homes
- 706 S Kenneth Rd
- 1230 Spazier Ave
- 523 E Cedar Ave Unit 101
- 900 E Santa Anita Ave
- 724 S Glenoaks Blvd
- 482 E Santa Anita Ave
- 1160 Elm Ave
- 1404 Sycamore Ave
- 638 E Tujunga Ave
- 1362 Linden Ave
- 315 E Valencia Ave
- 1245 Irving Ave
- 324 E Santa Anita Ave
- 1052 Elm Ave
- 2005 Chilton Dr
- 710 E Olive Ave
- 1164 Irving Ave
- 828 S Sunset Canyon Dr
- 1042 E Tujunga Ave
- 710 S San Fernando Blvd Unit 104
- 715 E Valencia Ave
- 709 E Valencia Ave
- 712 E Elmwood Ave
- 720 E Elmwood Ave
- 710 E Elmwood Ave
- 703 E Valencia Ave
- 723 E Valencia Ave
- 706 E Elmwood Ave
- 724 E Elmwood Ave
- 712 E Valencia Ave
- 718 E Valencia Ave
- 708 E Valencia Ave
- 701 E Valencia Ave
- 729 E Valencia Ave
- 702 E Valencia Ave
- 724 E Valencia Ave
- 700 E Elmwood Ave
- 730 E Elmwood Ave
- 733 E Valencia Ave
- 639 E Valencia Ave