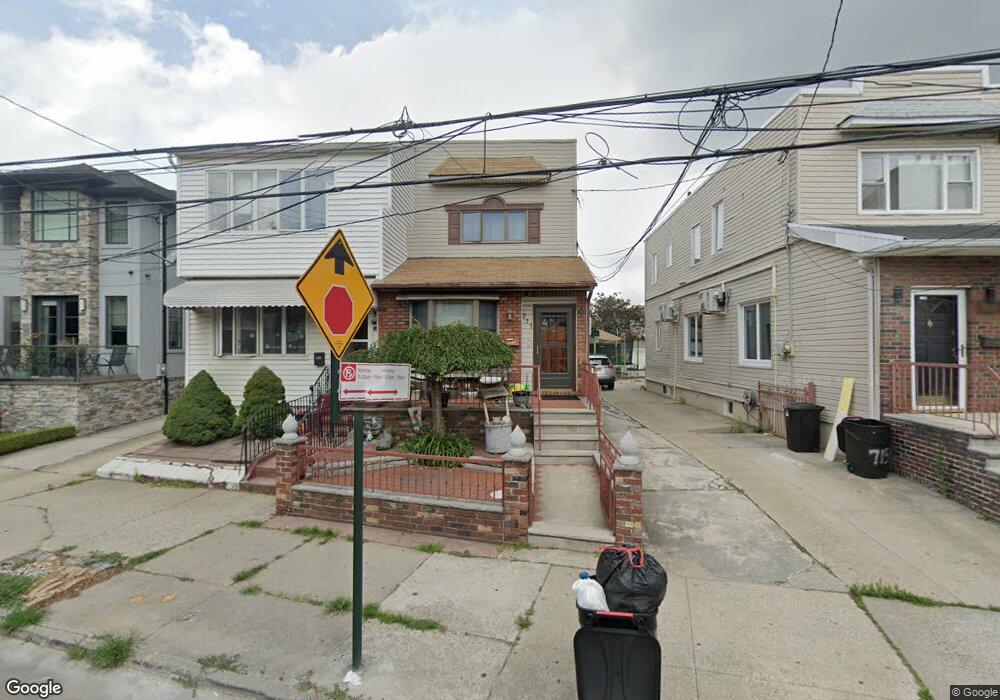
711 Gravesend Neck Rd Brooklyn, NY 11223
Gravesend NeighborhoodEstimated Value: $1,773,000 - $2,186,000
Studio
--
Bath
1,674
Sq Ft
$1,183/Sq Ft
Est. Value
About This Home
This home is located at 711 Gravesend Neck Rd, Brooklyn, NY 11223 and is currently estimated at $1,979,641, approximately $1,182 per square foot. 711 Gravesend Neck Rd is a home located in Kings County with nearby schools including P.S. 153 - Homecrest, Jhs 234 Arthur W Cunningham, and Abraham Lincoln High School.
Ownership History
Date
Name
Owned For
Owner Type
Purchase Details
Closed on
Jan 24, 2024
Sold by
Cutaneo Chris and Cutaneo Craig
Bought by
711 Neck Road Llc
Current Estimated Value
Home Financials for this Owner
Home Financials are based on the most recent Mortgage that was taken out on this home.
Original Mortgage
$1,120,000
Outstanding Balance
$1,091,235
Interest Rate
6.61%
Mortgage Type
Purchase Money Mortgage
Estimated Equity
$888,406
Purchase Details
Closed on
Jun 3, 2010
Sold by
Cutaneo Eugene and Cutaneo Sherry
Bought by
Cutaneo Eugene
Home Financials for this Owner
Home Financials are based on the most recent Mortgage that was taken out on this home.
Original Mortgage
$900,000
Interest Rate
4.98%
Mortgage Type
Reverse Mortgage Home Equity Conversion Mortgage
Create a Home Valuation Report for This Property
The Home Valuation Report is an in-depth analysis detailing your home's value as well as a comparison with similar homes in the area
Home Values in the Area
Average Home Value in this Area
Purchase History
We collect this data history from publicly available records. To have your information removed, we recommend requesting removal directly through your county’s website.
| Date | Buyer | Sale Price | Title Company |
|---|---|---|---|
| 711 Neck Road Llc | $1,950,000 | -- | |
| 711 Neck Road Llc | $1,950,000 | -- | |
| Cutaneo Eugene | -- | -- | |
| Cutaneo Eugene | -- | -- |
Source: Public Records
Mortgage History
We collect this data history from publicly available records. To have your information removed, we recommend requesting removal directly through your county’s website.
| Date | Status | Borrower | Loan Amount |
|---|---|---|---|
| Open | 711 Neck Road Llc | $1,120,000 | |
| Closed | 711 Neck Road Llc | $1,120,000 | |
| Previous Owner | Cutaneo Eugene | $900,000 |
Source: Public Records
Tax History
| Year | Tax Paid | Tax Assessment Tax Assessment Total Assessment is a certain percentage of the fair market value that is determined by local assessors to be the total taxable value of land and additions on the property. | Land | Improvement |
|---|---|---|---|---|
| 2026 | $7,045 | $118,560 | $13,680 | $104,880 |
| 2025 | $5,886 | $100,320 | $13,680 | $86,640 |
| 2024 | $5,886 | $90,960 | $13,680 | $77,280 |
| 2023 | $5,715 | $79,920 | $13,680 | $66,240 |
| 2022 | $5,263 | $65,400 | $13,680 | $51,720 |
| 2021 | $5,584 | $68,100 | $13,680 | $54,420 |
| 2020 | $2,728 | $69,060 | $13,680 | $55,380 |
| 2019 | $3,950 | $69,060 | $13,680 | $55,380 |
| 2018 | $4,672 | $26,154 | $3,870 | $22,284 |
| 2017 | $4,393 | $24,721 | $5,769 | $18,952 |
| 2016 | $4,321 | $24,721 | $6,950 | $17,771 |
| 2015 | $2,267 | $24,358 | $10,254 | $14,104 |
| 2014 | $2,267 | $22,990 | $10,028 | $12,962 |
Source: Public Records
Map
Nearby Homes
- 735 Avenue W Unit 3F
- 735 Avenue W Unit 3L
- 735 Avenue W Unit 6J
- 735 Avenue W Unit 6M
- 2265 Ocean Pkwy Unit 6N
- 2295 Ocean Pkwy
- 2530 Coney Island Ave
- 2184 E 9th St
- 2365 E 7th St
- 2367 E 7th St
- 2311 E 5th St
- 643 Crawford Ave
- 2310 Ocean Pkwy Unit 5J
- 2310 Ocean Pkwy Unit 3E
- 2310 Ocean Pkwy Unit 5C
- 2310 Ocean Pkwy Unit 3J
- 2156 Ocean Pkwy
- 2219 E 12th St
- 2125 E 9th St
- 2277 Homecrest Ave Unit 6G
- 715 Gravesend Neck Rd
- 709 Gravesend Neck Rd
- 705 Gravesend Neck Rd
- 719 Gravesend Neck Rd
- 703 Gravesend Neck Rd
- 723 Gravesend Neck Rd
- 2285 E 7th St
- 701 Gravesend Neck Rd
- 725 Gravesend Neck Rd
- 2252 E 8th St
- 2281 E 7th St
- 2250 E 8th St
- 727 Gravesend Neck Rd
- 2248 E 8th St
- 2277 E 7th St
- 729 Gravesend Neck Rd
- 2244 E 8th St
- 706 Gravesend Neck Rd
- 2275 E 7th St
- 702 Gravesend Neck Rd
Your Personal Tour Guide
Ask me questions while you tour the home.