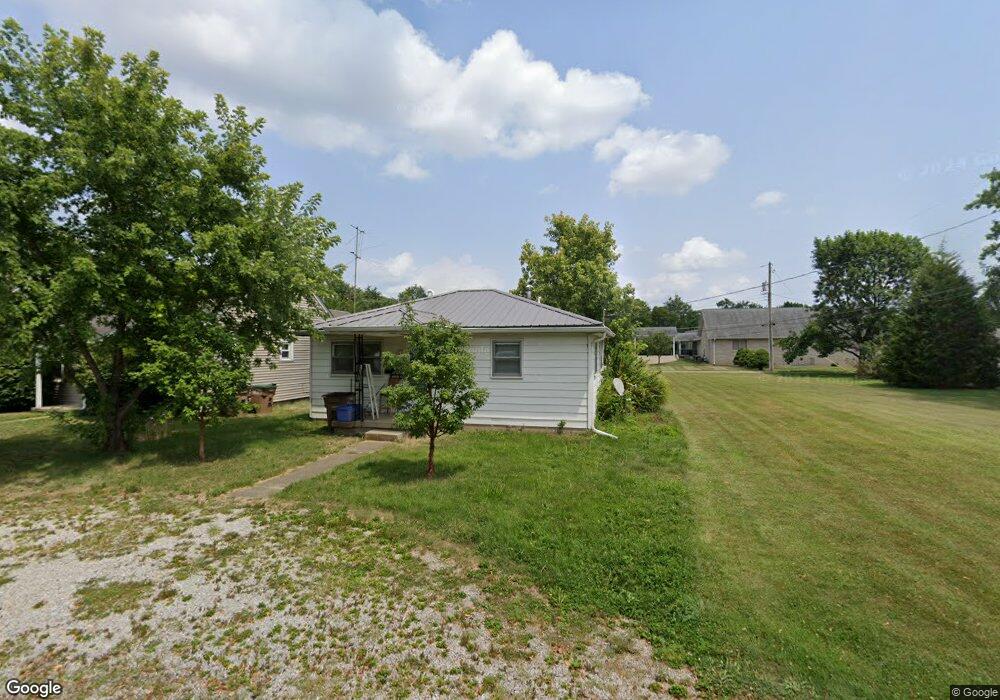
711 N Cherry St Columbus, IN 47201
Estimated Value: $108,000 - $157,000
1
Bed
1
Bath
672
Sq Ft
$205/Sq Ft
Est. Value
About This Home
This home is located at 711 N Cherry St, Columbus, IN 47201 and is currently estimated at $137,519, approximately $204 per square foot. 711 N Cherry St is a home located in Bartholomew County with nearby schools including L.F. Smith Elementary School, Central Middle School, and Columbus East High School.
Ownership History
Date
Name
Owned For
Owner Type
Purchase Details
Closed on
Oct 27, 2017
Sold by
Kell Michael R and Kell Susan C
Bought by
Delay Gregory T and Delay Connie S
Current Estimated Value
Purchase Details
Closed on
Nov 30, 2006
Sold by
Hood Juanita E
Bought by
Kell Erin O and Kell Michael R
Purchase Details
Closed on
Jul 27, 2000
Sold by
Gressel Betty I
Bought by
Hood Juanita E
Create a Home Valuation Report for This Property
The Home Valuation Report is an in-depth analysis detailing your home's value as well as a comparison with similar homes in the area
Home Values in the Area
Average Home Value in this Area
Purchase History
| Date | Buyer | Sale Price | Title Company |
|---|---|---|---|
| Delay Gregory T | -- | Stewart Title Company | |
| Kell Erin O | -- | Attorney | |
| Hood Juanita E | $50,000 | -- |
Source: Public Records
Tax History
| Year | Tax Paid | Tax Assessment Tax Assessment Total Assessment is a certain percentage of the fair market value that is determined by local assessors to be the total taxable value of land and additions on the property. | Land | Improvement |
|---|---|---|---|---|
| 2025 | $2,031 | $94,000 | $19,000 | $75,000 |
| 2024 | $1,988 | $90,300 | $19,000 | $71,300 |
| 2023 | $1,988 | $87,500 | $19,000 | $68,500 |
| 2022 | $1,905 | $84,100 | $19,000 | $65,100 |
| 2021 | $1,576 | $69,300 | $8,600 | $60,700 |
| 2020 | $1,142 | $50,400 | $8,600 | $41,800 |
| 2019 | $1,006 | $47,300 | $8,600 | $38,700 |
| 2018 | $1,083 | $45,700 | $8,600 | $37,100 |
| 2017 | $998 | $45,800 | $8,200 | $37,600 |
| 2016 | $982 | $44,900 | $8,200 | $36,700 |
| 2014 | $953 | $42,800 | $8,200 | $34,600 |
Source: Public Records
Map
Nearby Homes
- 2115 Irwin Dr
- 2035 10th St
- 507 N Cherry St
- 2100 12th St
- 2291 Mcclure St
- 844 Cottage Ave
- 2041 Mckinley Ave
- 1918 14th St
- 851 Werner Ave
- 2620 13th St
- 1609 Meridian St
- 2010 Stella Rock Trace
- 41 N Ross St
- 242 Woodlane Dr
- 1739 Caldwell Place
- 62 S Mapleton St
- 2911 14th St
- 1837 Caldwell Place
- 52 N Hinman St
- 1403 16th St
Your Personal Tour Guide
Ask me questions while you tour the home.