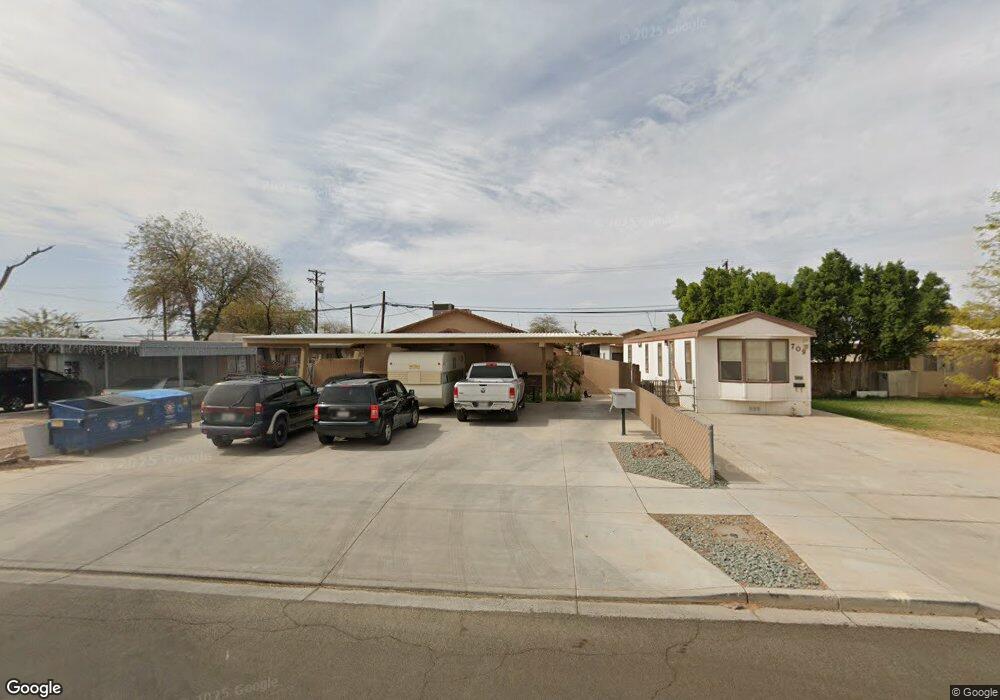
711 S Imperial Ave Unit A,B,C Imperial, CA 92251
Estimated Value: $464,719 - $613,000
3
Beds
1
Bath
2,600
Sq Ft
$206/Sq Ft
Est. Value
About This Home
This home is located at 711 S Imperial Ave Unit A,B,C, Imperial, CA 92251 and is currently estimated at $536,430, approximately $206 per square foot. 711 S Imperial Ave Unit A,B,C is a home located in Imperial County with nearby schools including T.L. Waggoner Elementary School, Frank M. Wright Middle School, and Imperial High School.
Ownership History
Date
Name
Owned For
Owner Type
Purchase Details
Closed on
Dec 15, 2022
Sold by
Walapai Trust
Bought by
Patton Cody
Current Estimated Value
Home Financials for this Owner
Home Financials are based on the most recent Mortgage that was taken out on this home.
Original Mortgage
$370,000
Outstanding Balance
$359,159
Interest Rate
7.08%
Mortgage Type
New Conventional
Estimated Equity
$177,271
Purchase Details
Closed on
Oct 15, 2019
Sold by
Roben Ray D
Bought by
Weakley Elva L
Purchase Details
Closed on
May 14, 2019
Sold by
Kidder Cynthia
Bought by
Roben Ray D
Purchase Details
Closed on
Jun 18, 2005
Sold by
Washington George
Bought by
Roben Ray D
Create a Home Valuation Report for This Property
The Home Valuation Report is an in-depth analysis detailing your home's value as well as a comparison with similar homes in the area
Home Values in the Area
Average Home Value in this Area
Purchase History
| Date | Buyer | Sale Price | Title Company |
|---|---|---|---|
| Patton Cody | $380,000 | Stewart Title Of California | |
| Weakley Elva L | $370,000 | Stewart Title Of California | |
| Roben Ray D | -- | Stewart Title Of California | |
| Roben Ray D | $78,000 | Chicago Title Co |
Source: Public Records
Mortgage History
| Date | Status | Borrower | Loan Amount |
|---|---|---|---|
| Open | Patton Cody | $370,000 |
Source: Public Records
Tax History Compared to Growth
Tax History
| Year | Tax Paid | Tax Assessment Tax Assessment Total Assessment is a certain percentage of the fair market value that is determined by local assessors to be the total taxable value of land and additions on the property. | Land | Improvement |
|---|---|---|---|---|
| 2025 | $4,307 | $395,352 | $83,232 | $312,120 |
| 2023 | $4,307 | $380,000 | $80,000 | $300,000 |
| 2022 | $4,315 | $381,308 | $61,833 | $319,475 |
| 2021 | $4,249 | $373,832 | $60,621 | $313,211 |
| 2020 | $4,206 | $370,000 | $60,000 | $310,000 |
| 2019 | $1,084 | $94,323 | $94,323 | $0 |
| 2018 | $1,070 | $92,474 | $92,474 | $0 |
| 2017 | $1,008 | $90,661 | $90,661 | $0 |
| 2016 | $972 | $88,884 | $88,884 | $0 |
| 2015 | $982 | $87,549 | $87,549 | $0 |
| 2014 | $918 | $85,835 | $85,835 | $0 |
Source: Public Records
Map
Nearby Homes