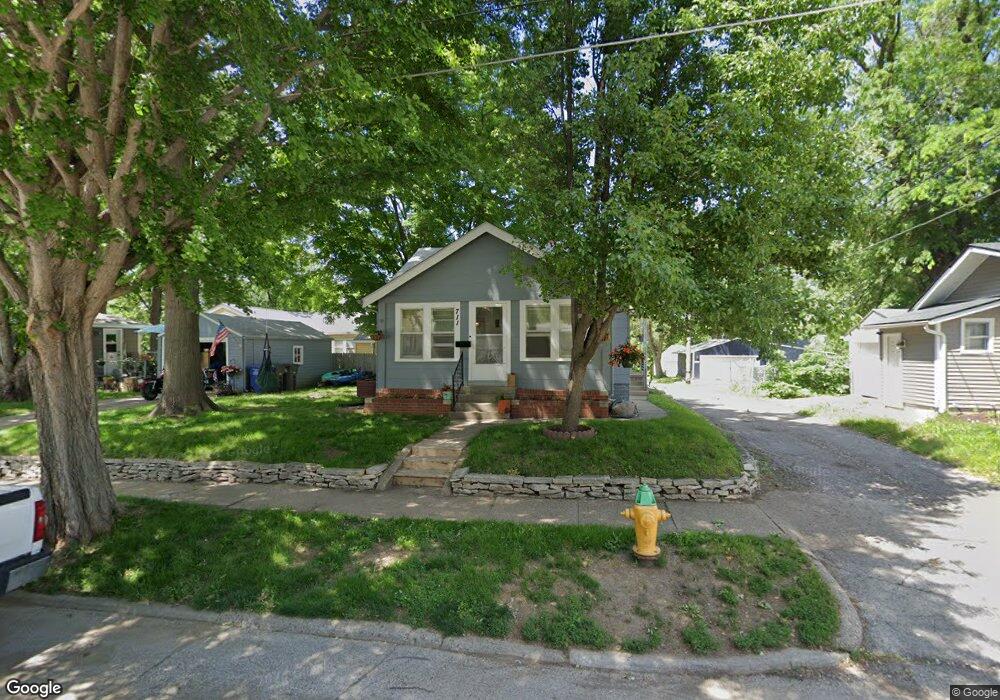
711 Seneca Ave Des Moines, IA 50313
Oak Park NeighborhoodEstimated Value: $97,000 - $104,250
1
Bed
1
Bath
576
Sq Ft
$175/Sq Ft
Est. Value
About This Home
This home is located at 711 Seneca Ave, Des Moines, IA 50313 and is currently estimated at $100,563, approximately $174 per square foot. 711 Seneca Ave is a home located in Polk County with nearby schools including Oak Park Elementary School, Harding Middle School, and North High School.
Ownership History
Date
Name
Owned For
Owner Type
Purchase Details
Closed on
Jul 1, 2011
Sold by
Federal Home Loan Mortgage Corporation
Bought by
Fc Storms & Company
Current Estimated Value
Purchase Details
Closed on
Feb 14, 2011
Sold by
Citimortgage Inc
Bought by
Federal Home Loan Mortgage Corporation
Purchase Details
Closed on
Jan 20, 2011
Sold by
Reedy Jerome A
Bought by
Citimortgage Inc
Purchase Details
Closed on
Dec 26, 2006
Sold by
Hoff Stephen C
Bought by
Roach Larry L
Home Financials for this Owner
Home Financials are based on the most recent Mortgage that was taken out on this home.
Original Mortgage
$52,500
Interest Rate
6.27%
Mortgage Type
Purchase Money Mortgage
Create a Home Valuation Report for This Property
The Home Valuation Report is an in-depth analysis detailing your home's value as well as a comparison with similar homes in the area
Home Values in the Area
Average Home Value in this Area
Purchase History
| Date | Buyer | Sale Price | Title Company |
|---|---|---|---|
| Fc Storms & Company | $10,900 | None Available | |
| Federal Home Loan Mortgage Corporation | -- | None Available | |
| Citimortgage Inc | $63,359 | None Available | |
| Roach Larry L | $52,000 | None Available |
Source: Public Records
Mortgage History
| Date | Status | Borrower | Loan Amount |
|---|---|---|---|
| Previous Owner | Roach Larry L | $52,500 |
Source: Public Records
Tax History Compared to Growth
Tax History
| Year | Tax Paid | Tax Assessment Tax Assessment Total Assessment is a certain percentage of the fair market value that is determined by local assessors to be the total taxable value of land and additions on the property. | Land | Improvement |
|---|---|---|---|---|
| 2025 | $1,534 | $89,400 | $15,700 | $73,700 |
| 2024 | $1,534 | $78,000 | $13,600 | $64,400 |
| 2023 | $1,484 | $78,000 | $13,600 | $64,400 |
| 2022 | $936 | $63,000 | $11,500 | $51,500 |
| 2021 | $814 | $63,000 | $11,500 | $51,500 |
| 2020 | $846 | $55,600 | $10,300 | $45,300 |
| 2019 | $750 | $55,600 | $10,300 | $45,300 |
| 2018 | $742 | $50,900 | $9,400 | $41,500 |
| 2017 | $628 | $50,900 | $9,400 | $41,500 |
| 2016 | $612 | $46,200 | $8,400 | $37,800 |
| 2015 | $612 | $46,200 | $8,400 | $37,800 |
| 2014 | $546 | $44,300 | $8,000 | $36,300 |
Source: Public Records
Map
Nearby Homes