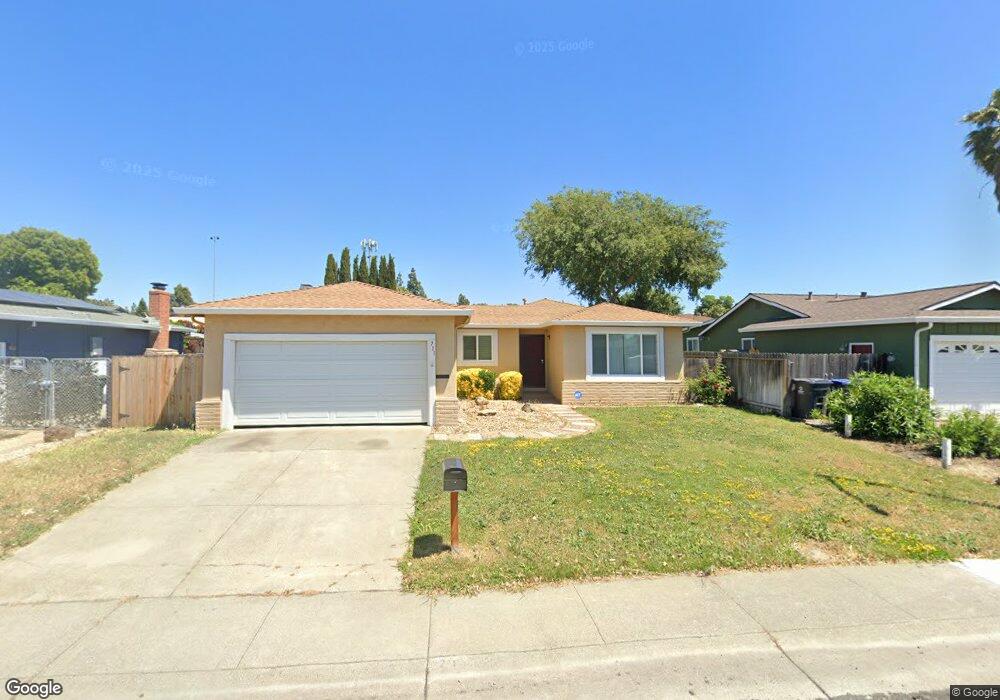
711 Shannon Dr Suisun City, CA 94585
Estimated Value: $486,723 - $534,000
3
Beds
2
Baths
1,342
Sq Ft
$381/Sq Ft
Est. Value
About This Home
This home is located at 711 Shannon Dr, Suisun City, CA 94585 and is currently estimated at $511,181, approximately $380 per square foot. 711 Shannon Dr is a home located in Solano County with nearby schools including Crescent Elementary School, Crystal Middle School, and Armijo High School.
Ownership History
Date
Name
Owned For
Owner Type
Purchase Details
Closed on
Oct 23, 2023
Sold by
David A Young Childs Trust and Young Family Trust
Bought by
Young David A
Current Estimated Value
Purchase Details
Closed on
Jul 29, 2016
Sold by
Clinton Robin and The Richard A Young Credit Tru
Bought by
Clinton Robin and The David A Young Childs Trust
Purchase Details
Closed on
Jan 8, 2003
Sold by
Young Lucille L and The Young Family Trust
Bought by
Young Lucille L and Lucille L Young Survivors Trus
Purchase Details
Closed on
Feb 8, 1999
Sold by
Young Richard and Young Lucille
Bought by
Young Richard A and Young Lucille L
Home Financials for this Owner
Home Financials are based on the most recent Mortgage that was taken out on this home.
Original Mortgage
$75,700
Interest Rate
6.79%
Purchase Details
Closed on
Jan 13, 1998
Sold by
Young Richard and Young Lucille
Bought by
Young Richard A and Young Lucille L
Create a Home Valuation Report for This Property
The Home Valuation Report is an in-depth analysis detailing your home's value as well as a comparison with similar homes in the area
Home Values in the Area
Average Home Value in this Area
Purchase History
| Date | Buyer | Sale Price | Title Company |
|---|---|---|---|
| Young David A | -- | None Listed On Document | |
| Clinton Robin | -- | None Available | |
| Clinton Robin | -- | None Available | |
| Young Lucille L | -- | -- | |
| Young Richard A | -- | -- | |
| Young Richard A | -- | Fidelity National Title Co | |
| Young Richard A | -- | -- |
Source: Public Records
Mortgage History
| Date | Status | Borrower | Loan Amount |
|---|---|---|---|
| Previous Owner | Young Richard A | $75,700 |
Source: Public Records
Tax History Compared to Growth
Tax History
| Year | Tax Paid | Tax Assessment Tax Assessment Total Assessment is a certain percentage of the fair market value that is determined by local assessors to be the total taxable value of land and additions on the property. | Land | Improvement |
|---|---|---|---|---|
| 2025 | $2,487 | $221,042 | $53,046 | $167,996 |
| 2024 | $2,487 | $216,708 | $52,006 | $164,702 |
| 2023 | $2,411 | $212,460 | $50,987 | $161,473 |
| 2022 | $2,382 | $208,295 | $49,988 | $158,307 |
| 2021 | $2,359 | $204,211 | $49,008 | $155,203 |
| 2020 | $2,304 | $202,118 | $48,506 | $153,612 |
| 2019 | $2,247 | $198,155 | $47,555 | $150,600 |
| 2018 | $2,343 | $194,271 | $46,623 | $147,648 |
| 2017 | $2,237 | $190,462 | $45,709 | $144,753 |
| 2016 | $2,217 | $186,728 | $44,813 | $141,915 |
| 2015 | $2,070 | $183,924 | $44,140 | $139,784 |
| 2014 | $2,057 | $180,322 | $43,276 | $137,046 |
Source: Public Records
Map
Nearby Homes
- 56 Terry Ln
- 519 Rio Verde
- 85 Coral Ln
- 116 Birchwood Ct
- 114 Birchwood Ct
- 79 Chipman Ln
- 906 Taft St
- 230 Empire Place
- 249 E Tennessee St
- 145 Summertime Ln
- 518 Carolina St
- 141 Summertime Ln
- 1105 Strawberry Ln
- 1113 Strawberry Ln
- 1125 Strawberry Ln
- 813 Redhead Way
- 800 Spoonbill Ln
- 915 Liberty Dr
- 224 E Colorado St
- 8 Deck Dr