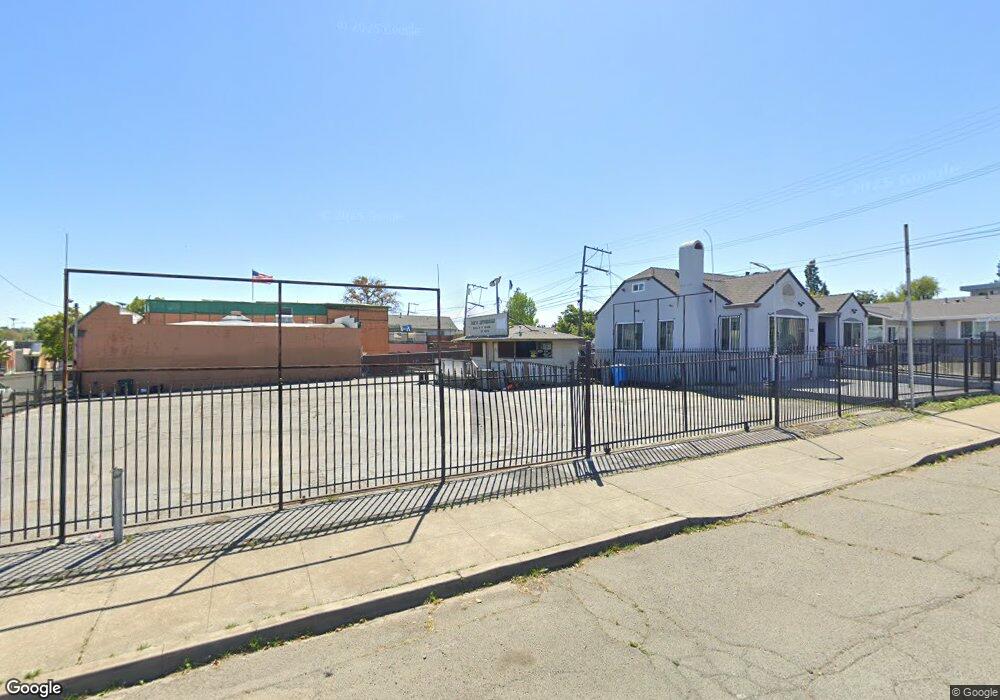
711 Tennessee St Vallejo, CA 94590
West Vallejo NeighborhoodEstimated Value: $207,110
Studio
--
Bath
315
Sq Ft
$657/Sq Ft
Est. Value
About This Home
This home is located at 711 Tennessee St, Vallejo, CA 94590 and is currently estimated at $207,110, approximately $657 per square foot. 711 Tennessee St is a home located in Solano County with nearby schools including Highland Elementary, Vallejo High School, and Elite Public.
Ownership History
Date
Name
Owned For
Owner Type
Purchase Details
Closed on
Dec 5, 2025
Sold by
Zeidan Ziyad
Bought by
Jamshidi Saivash
Current Estimated Value
Purchase Details
Closed on
Dec 4, 2025
Sold by
Zeidan Luma
Bought by
Zeidan Ziyad
Purchase Details
Closed on
Sep 25, 2023
Sold by
Ronald L Garibaldi Family Trust and Garibaldi William R
Bought by
Zeidan Ziyad
Purchase Details
Closed on
Nov 22, 2013
Sold by
Garibaldi Ronald L
Bought by
Garibaldi Ronald L
Purchase Details
Closed on
Nov 23, 2009
Sold by
Garibaldi Ryan and Sells Ronda
Bought by
Garibaldi Ronald L and Garibaldi William R
Purchase Details
Closed on
Jul 17, 2009
Sold by
Garibaldi Ryan
Bought by
Garibaldi Ryan and Sells Ronda
Purchase Details
Closed on
Jun 8, 2001
Sold by
Plantz Havilah Louise
Bought by
Plantz Havilah L
Purchase Details
Closed on
Jun 10, 1999
Sold by
Plantz Havilah L and Plantz Mark Z
Bought by
Plantz Havilah Louise
Purchase Details
Closed on
Mar 4, 1997
Sold by
Gordon Garibaldi Antone
Bought by
Plantz Havilah L
Purchase Details
Closed on
Jun 6, 1980
Sold by
Garibaldi William R
Bought by
Garibaldi William R and Garibaldi Gloria I
Create a Home Valuation Report for This Property
The Home Valuation Report is an in-depth analysis detailing your home's value as well as a comparison with similar homes in the area
Home Values in the Area
Average Home Value in this Area
Purchase History
| Date | Buyer | Sale Price | Title Company |
|---|---|---|---|
| Jamshidi Saivash | $230,000 | Fidelity National Title | |
| Zeidan Ziyad | -- | Fidelity National Title | |
| Zeidan Ziyad | $220,000 | Placer Title | |
| Garibaldi Ronald L | -- | None Available | |
| Garibaldi Ronald L | $27,000 | First American Title Company | |
| Garibaldi Ryan | -- | None Available | |
| Plantz Havilah L | -- | -- | |
| Plantz Havilah Louise | -- | -- | |
| Plantz Havilah L | -- | -- | |
| Garibaldi William R | -- | -- |
Source: Public Records
Tax History
| Year | Tax Paid | Tax Assessment Tax Assessment Total Assessment is a certain percentage of the fair market value that is determined by local assessors to be the total taxable value of land and additions on the property. | Land | Improvement |
|---|---|---|---|---|
| 2025 | $3,377 | $224,400 | $219,300 | $5,100 |
| 2024 | $3,377 | $127,588 | $120,773 | $6,815 |
| 2023 | $2,228 | $125,087 | $118,405 | $6,682 |
| 2022 | $2,353 | $122,635 | $116,083 | $6,552 |
| 2021 | $2,301 | $120,231 | $113,807 | $6,424 |
| 2020 | $2,291 | $119,000 | $112,641 | $6,359 |
| 2019 | $2,204 | $116,668 | $110,433 | $6,235 |
| 2018 | $2,053 | $114,381 | $108,268 | $6,113 |
| 2017 | $1,411 | $112,140 | $106,146 | $5,994 |
| 2016 | $1,401 | $109,942 | $104,065 | $5,877 |
| 2015 | $1,384 | $108,291 | $102,502 | $5,789 |
| 2014 | $1,264 | $106,171 | $100,495 | $5,676 |
Source: Public Records
Map
Nearby Homes
- 1511 Napa St
- 1131 Tennessee St
- 900 Alameda St
- 327 Arkansas St
- 325 Arkansas St
- 1038 Alabama St
- 125 Broadway St
- 601 Alabama St
- 1158 Louisiana St
- 939 Ohio St
- 1322 Sutter St
- 1121 Ohio St
- 844 Kentucky St
- 729 Ohio St
- 717 Ohio St
- 918 Alameda St
- 124 Illinois St
- 0 Mississippi St
- 240 Mississippi St
- 734 Florida St
- 1516 Napa St
- 816 Alabama St
- 1500 Napa St
- 820 Alabama St
- 824 Alabama St
- 650 Tennessee St
- 731 Tennessee St
- 1601 Napa St
- 646 Tennessee St
- 740 Alabama St
- 644 Tennessee St
- 830 Alabama St
- 712 Tennessee St
- 734 Alabama St
- 641 Tennessee St
- 1608 Napa St
- 732 Alabama St
- 737 Tennessee St
- 1605 Fern Place
- 809 Alabama St
Your Personal Tour Guide
Ask me questions while you tour the home.