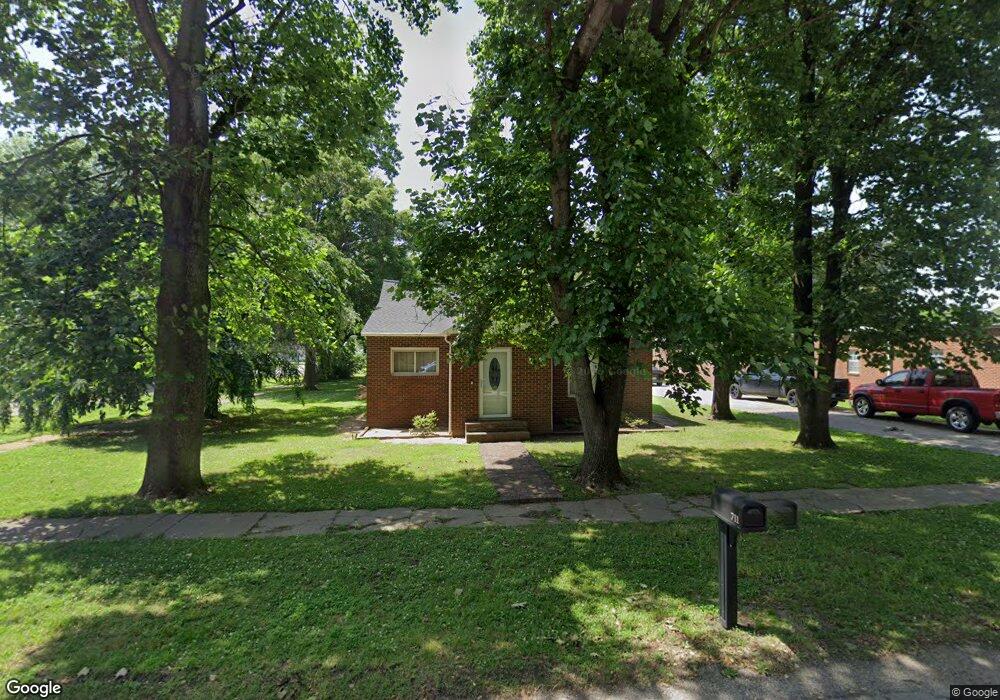
711 W 3rd St Corning, AR 72422
Estimated Value: $106,000 - $135,000
Studio
2
Baths
2,054
Sq Ft
$56/Sq Ft
Est. Value
About This Home
This home is located at 711 W 3rd St, Corning, AR 72422 and is currently estimated at $115,869, approximately $56 per square foot. 711 W 3rd St is a home located in Clay County with nearby schools including Park Elementary School, Central Elementary School, and Corning Middle School.
Ownership History
Date
Name
Owned For
Owner Type
Purchase Details
Closed on
Sep 30, 2013
Sold by
Holifield Patsy Stafford and Stafford Cleo
Bought by
Williams Robert A and Williams Crystal D
Current Estimated Value
Home Financials for this Owner
Home Financials are based on the most recent Mortgage that was taken out on this home.
Original Mortgage
$62,000
Outstanding Balance
$46,521
Interest Rate
4.54%
Mortgage Type
New Conventional
Estimated Equity
$69,348
Purchase Details
Closed on
Jan 21, 1994
Bought by
Stafford
Create a Home Valuation Report for This Property
The Home Valuation Report is an in-depth analysis detailing your home's value as well as a comparison with similar homes in the area
Home Values in the Area
Average Home Value in this Area
Purchase History
| Date | Buyer | Sale Price | Title Company |
|---|---|---|---|
| Williams Robert A | -- | -- | |
| Stafford | $53,000 | -- | |
| Stafford | -- | -- |
Source: Public Records
Mortgage History
| Date | Status | Borrower | Loan Amount |
|---|---|---|---|
| Open | Williams Robert A | $62,000 |
Source: Public Records
Tax History
| Year | Tax Paid | Tax Assessment Tax Assessment Total Assessment is a certain percentage of the fair market value that is determined by local assessors to be the total taxable value of land and additions on the property. | Land | Improvement |
|---|---|---|---|---|
| 2025 | $632 | $12,270 | $400 | $11,870 |
| 2024 | $132 | $12,270 | $400 | $11,870 |
| 2023 | $146 | $12,270 | $400 | $11,870 |
| 2022 | $362 | $15,860 | $800 | $15,060 |
| 2021 | $362 | $15,860 | $800 | $15,060 |
| 2020 | $362 | $15,860 | $800 | $15,060 |
| 2019 | $339 | $15,860 | $800 | $15,060 |
| 2018 | $332 | $15,860 | $800 | $15,060 |
| 2017 | $649 | $13,960 | $800 | $13,160 |
| 2016 | -- | $13,960 | $800 | $13,160 |
| 2015 | -- | $13,960 | $800 | $13,160 |
| 2014 | -- | $13,960 | $800 | $13,160 |
| 2013 | -- | $13,960 | $800 | $13,160 |
Source: Public Records
Map
Nearby Homes
- 4 Sand Ave
- 3.9 acres Sand Ave
- 110 Edith St
- 100 Logan Ln
- 725 Sharon Cir
- 303 NW 3rd St
- 219 Edith St Unit 217
- 212 N Park St
- 1004 Maddox St
- 1310 Jones St
- 310 Hope St
- 413 NW 3rd St
- 510 Kenmore St
- 1 E Elm & Hwy 62 E
- 0 E Elm St
- 2510 Overdene St
- 112 Scott St
- 00 County Road 173
- 195, 18, 208 Cr 137
- 111 Cr 1412
Your Personal Tour Guide
Ask me questions while you tour the home.